| Issue |
A&A
Volume 559, November 2013
|
|
|---|---|---|
| Article Number | A2 | |
| Number of page(s) | 10 | |
| Section | Cosmology (including clusters of galaxies) | |
| DOI | https://doi.org/10.1051/0004-6361/201322345 | |
| Published online | 28 October 2013 | |
A large-scale galaxy structure at z = 2.02 associated with the radio galaxy MRC 0156-252⋆,⋆⋆
1 INAF – Osservatorio di Roma, via Frascati 33, 00040 Monteporzio, Italy
e-mail: This email address is being protected from spambots. You need JavaScript enabled to view it.
2 Jet Propulsion Laboratory, California Institute of Technology, 4800 Oak Grove Dr., Pasadena, CA 91109, USA
3 European Southern Observatory, Karl-Schwarzschild-Strasse 2, 85748 Garching, Germany
4 University of Nottingham, School of Physics and Astronomy, Nottingham NG7 2RD, UK
5 Max-Planck-Institut für extraterrestrische Physik (MPE), Postfach 1312, Giessenbachstr., 85741 Garching, Germany
6 Observatório Nacional, Rua José Cristino 77, CEP 20921-400 São Cristóvão, Rio de Janeiro, RJ, Brazil
7 Department of Astronomy, The University of Texas at Austin, 2515 Speedway, Stop C1400, Austin, TX 78712, USA
8 Department of Astrophysics, California Institute of Technology, MS 249-17, Pasadena, CA 91125, USA
9 CSIRO Astronomy & Space Science, PO Box 76, NSW 1710 Epping, Australia
Received: 23 July 2013
Accepted: 25 September 2013
Abstract
We present the spectroscopic confirmation of a structure of galaxies surrounding the radio galaxy MRC 0156-252 at z = 2.02. The structure was initially discovered as an overdensity of both near-infrared selected z > 1.6 and mid-infrared selected z > 1.2 galaxy candidates. We used the VLT/FORS2 multi-object spectrograph to target ~80 high-redshift galaxy candidates, and obtain robust spectroscopic redshifts for more than half the targets. The majority of the confirmed sources are star-forming galaxies at z > 1.5. In addition to the radio galaxy, two of its close-by companions (<6″) also show AGN signatures. Ten sources, including the radio galaxy, lie within | z − 2.020 | <0.015 (i.e., velocity offsets <1500 km s-1) and within projected 2 Mpc comoving of the radio galaxy. Additional evidence suggests not only that the galaxy structure associated with MRC 0156-252 is a forming galaxy cluster but also that this structure is most probably embedded in a larger-scale structure.
Key words: galaxies: clusters: general / galaxies: clusters: individual: MRC 0156-252 / large-scale structure of Universe / galaxies: individual: MRC 0156-252
Appendix A is available in electronic form at http://www.aanda.org
Based on observations obtained at the European Southern Observatory using the Very Large Telescope on Cerro Paranal through ESO programme 090.A-0734 (P.I. A. Galametz).
© ESO, 2013
1. Introduction
Galaxy clusters are the densest, most massive gravitationally bound regions, emerging from the highest fluctuation peaks in the matter distribution of the early universe. They therefore provide crucial constraints on cosmological models (e.g., Jimenez & Verde 2009) as well as on scenarios of galaxy formation. As large reservoirs of galaxies at a specific cosmic time, they also provide unique laboratories to investigate galaxy evolution.
Decades of studies have drawn a relatively accurate picture of the state and physical processes occurring within galaxy clusters at low to intermediate redshift. Clusters possess a core dominated by massive, early-type galaxies forming a tight red sequence, up to at least z ~ 1.5 (Lidman et al. 2008; Nastasi et al. 2011). A primary challenge for this field is to push cluster discoveries to higher redshift in order to investigate the formation epoch and physical processes that lead to the present-day structures.
However, until recently, our knowledge of high-redshift galaxy clusters was relatively sparse with only a handful of confirmed systems at z > 1.5. Discoveries of galaxy clusters at higher redshift were mainly restricted by the limitation of classical cluster search methods such as the detection of extended X-ray emission from the intracluster medium (ICM; e.g., Stanford et al. 2006; Fassbender et al. 2011) which is limited by the diminishing surface brightness, the red-sequence techniques shifted to the near-infrared at z > 1.5, or the promising Sunyaev-Zeldovich (SZ) cluster surveys that are, to date, still restricted to z ~ 1.5 (e.g., Vanderlinde et al. 2010; Foley et al. 2011; Stalder et al. 2013; Planck Collaboration 2013; Bayliss et al. 2013).
Over the last decade, two alternative techniques have proven efficient at finding high-redshift galaxy structures. On one hand, studies have used the great sensitivity of the Spitzer telescope and in particular its InfraRed Array Camera (IRAC; Fazio et al. 2004) to identify z > 1.2 galaxy clusters. The IRAC colour [3.6] − [4.5] is very efficient at selecting high-redshift galaxies (z > 1.2) and therefore at isolating high-redshift clusters (Eisenhardt et al. 2008; Papovich 2008; Galametz et al. 2012; Wylezalek et al. 2013). A large number of confirmed high-redshift (z > 1.5) galaxy (proto-)clusters were found and confirmed through spectroscopic follow-up of overdensities of IRAC red sources – e.g., SXDF-XCLJ0218-0510 at z = 1.62 (Papovich et al. 2010; Tanaka et al. 2010), IDCS J1426+3508 at z = 1.75 (Stanford et al. 2012) and CL J1449-0856 at z = 2.0 (Gobat et al. 2013). These galaxy (proto-)clusters were, however, discovered through field surveys, i.e., serendipitously. Finding larger samples of high-redshift galaxy clusters would require field surveys even wider than the several tens of square-degrees which are the current state-of-the-art.
On the other hand, targeted searches in the surroundings of powerful high-redshift radio galaxies have proven quite effective. Radio galaxies are amongst the most massive sources in the Universe with masses of M > 1011 M⊙ (Seymour et al. 2007) and preferentially inhabit dense environments. The first searches of high-redshift galaxy structures in the environments of radio galaxies typically focussed at 2 < z < 5. They made use of narrow-band imaging to detect emission line objects such as Lyα and Hα emitters (e.g., Pentericci et al. 2000; Kurk et al. 2004; Venemans et al. 2004, 2007; Hayashi et al. 2010; Koyama et al. 2013) that are usually not very massive (a few 108M⊙; Overzier et al. 2008) and likely to be young star-forming galaxies. An overdensity of star-forming galaxies at z = 2.3 ± 0.4 was also reported in the field of the bright z = 2.72 QSO HS1700+643 (Steidel et al. 2005).
Complementary studies have attempted to reveal the massive evolved population in these galaxy structures at z ≥ 2 (e.g., Kajisawa et al. 2006; Tanaka et al. 2007; Zirm et al. 2008; Galametz et al. 2009a, 2010b) in order to determine the epoch of appearance of the first red sequence galaxies. However, most of these confirmed galaxy structures at z ≥ 2 are still in the act of collapsing i.e. they are likely proto-clusters which are are not yet part of an evolved and quasi-virialized dark matter halo. Although there has been evidence of a mixed population of both star-forming and quiescent galaxies in protoclusters at z ~ 2 with the latest formed between zf ~ 3 and 4 (Tanaka et al. 2013), attempts at confirming red sequence objects in proto-clusters at z ~ 2 have been challenging with even the reddest galaxies showing on-going star-formation (Doherty et al. 2010). However, significant star formation activity has also been observed in the cores of massive clusters at z ~ 1.5 and beyond (e.g. Tran et al. 2010; Hayashi et al. 2010; Fassbender et al. 2011; Bayliss et al. 2013; Lotz et al. 2013). The cosmic epoch at z > 1.5 is therefore crucial for the development of the dominant red and dead cluster galaxy population observed in lower redshift cluster environments. In this respect, detailed studies of galaxy population properties in proto-clusters at z ≥ 2 can provide important insights on the early evolution, environmental effects, and physical processes that drive galaxy evolution in dense environments.
Recent programs have intended to combine the two cluster searching techniques mentioned above to systematically look for (proto)clusters in the fields of radio galaxies using IRAC 3.6 and 4.5 μm data: e.g., the Spitzer High-z Radio Galaxy survey (SHzRG; Galametz et al. 2012) and its extension (both in sample size and to type 1 AGN), the Clusters Around Radio-Loud AGN survey (CARLA; Wylezalek et al. 2013).
In this paper, we present spectroscopic observations of a galaxy structure found in the field of the radio galaxy MRC 0156-252 (z = 2.026) that was part of the SHzRG sample and found to lie in an overdense region of both IRAC-selected galaxies (Galametz et al. 2012, and Sect. 3) and near-infrared-selected high-redshift galaxy candidates (Galametz et al. 2010a, and Sect. 2).
We follow-up the galaxy structure candidate with the optical multi-object FOcal Reducer and low dispersion Spectrograph (FORS2) at VLT. Sections 2 and 3 provide information on the radio galaxy itself and the candidates selection, respectively. Section 4 details the observations, data reduction and spectroscopic redshift assignments. Section 5 reports on the close-by companions of MRC 0156-252. Section 6 presents the galaxy structure found at z = 2.020 and a comparison of this structure with current known galaxy clusters and protoclusters at similar cosmic time. Section 7 summarizes our results.
Throughout the paper, we assume a ΛCDM cosmology with H0 = 70 km s-1 Mpc-1, Ωm = 0.3 and ΩΛ = 0.7. All magnitudes are expressed in the AB photometric system.
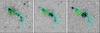 |
Fig. 1 The 15″ × 15″ (~125 kpc × 125 kpc at z ~ 2) immediate surroundings of MRC 0156-252 at optical and near-infrared wavelengths: B-band pre-imaging (left panel; this work) and Y (middle) and Ks (right) bands (G10). North is up; East is to the left. The two FORS2 slits dedicated to observing the different radio galaxy companions are shown in cyan (positions angles of − 55° and − 10° for the first and second mask, respectively). Radio contours from 4.7 GHz imaging by the VLA are overplotted in green (Carilli et al. 1997). The radio galaxy and companions are designated by “A”, “B”, “C”, and “D” for consistency with the notation of Pentericci et al. (2001) and G10. We introduce “A′” for the closest source to A revealed by the FORS2 B-band image and “E” for a suspected faint companion at the edge of the SW radio lobe. |
2. MRC 0156-252
MRC 0156-252 was first reported in Large et al. (1981) as part of the Molonglo Reference Catalogue of Radio Sources. An optical spectrum of the radio galaxy revealed three emission lines that McCarthy et al. (1990) identified as Lyα, CIV and HeII at a redshift of z = 2.016. MRC 0156-252 has narrow Lyα emission and shows an extended optical morphology (McCarthy et al. 1990) but it is unresolved at near-infrared wavelengths (McCarthy et al. 1992). This led McCarthy (1993) to conclude that MRC 0156-252 has an old stellar population with some on-going star-formation that could explain the extended rest frame UV emission. Based on a later near-infrared spectrum of MRC 0156-252 and the study of its broad Hα line, Eales & Rawlings (1996) suggested that MRC 0156-252 might actually be a quasar largely obscured by dust. They also found that the peak of the Hα line was redshifted by ~1000 km s-1 compared to what expected at z = 2.016. Although they note that similar offsets have been observed for other high-redshift quasars, we find that the higher quality FORS2 spectroscopy presented in Sect. 4 revises the redshift of MRC 0156-252 to z = 2.0256, consistent with the position of the Hα line from Eales & Rawlings (1996).
Radio galaxies show a range of morphologies often with clumpy structures (Pentericci et al. 1999; Galametz et al. 2009a). MRC 0156-256 has, at least, four bright close-by companions previously reported in McCarthy et al. (1990), Pentericci et al. (2001) and Galametz et al. (2010a), including the brightest source (in the near-infrared) usually identified as the radio source. Figure 1 shows the 15″ × 15″ immediate surroundings of MRC 0156-252 in B (pre-imaging; see Sect. 4.1), Y and Ks. The majority of the companions are aligned in the direction of the radio axis (~NE / SW) and spread over less than 11″. Source A is the brightest source that coincides with the position of the radio core. Source B is located at the very edge of the NE radio lobe and has very blue colours, possibly due to enhanced star-formation triggered by the radio jet (Pentericci et al. 2001). A faint companion (E) is detected at the edge of the SW radio lobe. Source D, found ~5″ SW of A, also has blue colours. The FORS2 B-band image reveals that D has a disturbed morphology with a brighter compact “core” and an extension to the South. Source C is located ~6″ NE of A and has red near-infrared colours. An additional source (A′) was also revealed by the optical data within  of the radio galaxy.
3. Identification of a galaxy cluster candidate in the field of MRC 0156-252
As previously mentioned, several pieces of evidence suggest that MRC 0156-252 is embedded in a (proto)cluster at high redshift.
MRC 0156-252 was found to lie in an overdensity of near-infrared selected z > 1.6 galaxy candidates (Galametz et al. 2010a; G10 hereafter). G10 introduces a purely near-infrared two-colour YHK selection criterion to isolate galaxies at 1.6 < z < 3 and differentiate between old, red stellar populations and young, blue star-forming galaxies, designated as r-YHK and b-YHK, respectively. We refer to G10 for details on the colour selection technique. At the depth of the near-infrared data, the field of MRC 0156-252 was found to be ~3 times denser than control fields in YHK-selected galaxies including the GOODS-South field, which is known to host a galaxy protocluster at z ~ 1.6 (Castellano et al. 2007; Kurk et al. 2009). Half of the r-YHK galaxies have colours consistent with red sequence models at z ~ 2. G10 therefore concluded that MRC 0156-252 is likely associated with a galaxy (proto)cluster at z ~ 2. Figure 2 shows the spatial distribution of the r-YHK and b-YHK selected sources in the field of MRC 0156-252.
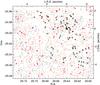 |
Fig. 2 Spatial distribution of high-redshift galaxy candidates in the field of MRC 0156-252. Blue and red circles show b-YHK and r-YHK, respectively (z > 1.6 candidates; G10). Pink circles show IRAC-selected sources (z > 1.2 candidates; G12). MRC 0156-252 is shown by the green star. Density distribution of the full YHK + IRAC selected sample are shown by the dashed gray contours. The spectroscopic targets are highlighted by open black circles. Four bright, low-redshift galaxies chosen for mask alignment are shown by open black squares. We note that two have colours consistent with IRAC-selected sources which shows the possible contamination of the IRAC selection by low-redshift galaxies. |
MRC 0156-252 was also found to lie in an overdensity of mid-infrared selected z > 1.2 galaxy candidates (Galametz et al. 2012; G12 hereafter). G12 studied the environment of 48 high-redshift (1.2 < z < 3) radio galaxies – including MRC 0156-252 – in order to identify potential associated galaxy clusters. G12 made use of a single red IRAC colour cut ([3.6] − [4.5] > −0.1) to isolate z > 1.2 galaxies (Papovich et al. 2008, Wylezalek et al. 2013). The field of MRC 0156-252 was the ninth densest field in red IRAC-selected galaxies, overdense at a 3σ level compared to average. Its surface density of IRAC-selected galaxies was found to be consistent with the CL J1449+0856 z ~ 2 protocluster (Gobat et al. 2011). G12 therefore also concluded that MRC 0156-252 is indeed embedded in a high-redshift galaxy (proto)cluster. The spatial distribution of the red IRAC-selected sources in the field of MRC 0156-252 is also reported in Fig. 2.
4. VLT/FORS2 spectroscopy
We conducted spectroscopic observations with VLT/FORS2 to confirm the membership of the cluster member candidates in the field of MRC 0156-252.
4.1. Mask design and targets
Only limited shallow optical data were available in the field of MRC 0156-252 prior to the FORS2 run from Las Campanas (r, I and Lyα data; McCarthy et al. 1990; Pentericci et al. 2001) and HST/WFPC2 (F555W; Overzier et al. 2005). To accurately design the masks for the FORS2 spectroscopy, we obtained deep (3.8 h) imaging in the bHIGH band (λ = 440 nm corresponding to ~145 nm rest frame at z = 2.02; referred to as B hereafter). The B-band was chosen to match the wavelength range covered by the spectroscopy. The data were reduced using standard IRAF reduction tools and source extraction was done using SExtractor (Bertin & Arnouts 1996).
We designed two slit masks and chose their orientations to optimize the observations of the radio galaxy and its neighbors i.e., positions angle of − 55° for the first mask and − 10° for the second. Figure 1 shows the two slits that were designed to observe the radio galaxy companions. One slit of the first mask was placed along the radio axis to target sources A, A′, B and D. We did not observe source C and chose to elongate the slit towards the South for an optimal sky subtraction. Source C is barely detected in the B-band and thus it is expected to be quite challenging to confirm through optical spectroscopy. One slit of mask 2 targeted the southern extended companion of the radio galaxy (source D and its extension to the South). The rest of the masks were designed as follows: the first mask was preferentially filled with sources that are relatively bright in the B-band (B < 23). The second mask was filled with sources down to a fainter (B < 24) magnitude.
In total, we targeted 83 distinct sources (two r-YHK selected sources were common to both masks): the radio galaxy and neighbors (2 slits), 12 r-YHK selected sources (including 6 IRAC-selected sources), 31 b-YHK selected sources (including 25 IRAC-selected sources), 33 red IRAC-selected sources, one mid-infrared selected AGN candidate (G12) – identified by the four IRAC bands AGN colour wedge from Stern et al. (2005) – and four additional bright, nearby sources to check the mask alignment.
4.2. Observations and data reduction
The two slit masks were observed on UT 2012 October 20 using the MXU mode of FORS2 with the blue-optimized detector and the 300V+10 grism with no order-sorting filter to cover a typical wavelength range of 3300 − 6600 Å (1100 − 2200 Å at z = 2). Mask 1 and Mask 2 (filled with fainter targets) were exposed for 3 h and 4.4 h total, respectively. The sky conditions were clear with an average 0.6′′ seeing throughout the night.
We reduced the spectroscopic data using “BOGUS”1, an IRAF script designed for efficient processing of multi-slit data. The pipeline includes classical reduction steps such as flat-fielding, cosmic ray rejection, sky subtraction, and combination of independent exposures. The 1D spectra were extracted using IRAF. The uncertainties on the wavelength calibration were estimated from the sky lines to be ~0.2 Å.
4.3. Spectroscopy results
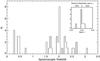 |
Fig. 3 Distribution of the available spectroscopic redshifts. The inset panel zooms in on the redshift range 2.00 < z < 2.04. The top axis indicates the corresponding velocity distribution relative to z = 2.020. |
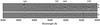 |
Fig. 4 2D spectra of the radio galaxy and close-by neighbours (inverse gray scale) corresponding to the two slits in Fig. 1 with position angles of − 55° (top; sources A and B) and −10° (bottom; source D). The vertical lines point to the position of the four detected emission lines (Lyαλ1216, CIV λ1550, HeII λ1640, CIII] λ1909) at the redshift of A. Continua of sources A, B and D are indicated by the horizontal ticks. |
Spectroscopic redshifts (zspec) were assigned to 43 galaxies. The redshifts were determined using EZ (Garilli et al. 2010). The majority of the derived redshifts are at a high-confidence level with at least three strong absorption lines or two strong emission lines. Quality flags “B” were assigned to redshifts with weakly detected absorption lines. Redshift uncertainties were derived by summing in quadrature the fitting and wavelength calibration uncertainties. Figure 3 shows the distribution of our spectroscopic redshifts. Appendix A reports the identification number (in the B-band) of these 43 sources with zspec, coordinates, target selection technique, spectroscopic redshifts and detected absorption/emission lines for the members of the galaxy structure associated with MRC 0156-252 (see Sect. 6 and Table A.1) and for foreground/background galaxies (Table A.2).
Mainly due to the wavelength coverage probed by the FORS2 configuration, we did not confirm any galaxy in the redshift range 1 < zspec < 1.5. Galaxies with zspec < 1 were mostly confirmed thanks to their [OII] emission doublet. A large fraction of the galaxies with zspec > 1.5 are star-forming galaxies and present a clear continuum discontinuity due to the Lyα forest in addition to standard absorption lines (e.g., SiII1260; OI/SiII; CII; SiIV; SiII1526; CIV; FeII; AlII; SiII1808; AlIII). Four sources have AGN signatures at 2.0 < zspec ≤ 2.2 including sources B and D. Due to the adopted spectrograph configuration, we should in principle be able to detect Lyα for galaxies at z > 1.8, provided they are star-forming and do not contain dust. A Lyα emission line was observed in 8 of the 24 galaxies confirmed at z > 1.8.
We obtained spectroscopic redshifts for 32 of the 58 (~55%) targeted IRAC-selected galaxies. 27 of them (~84%) have, as expected from their mid-infrared colours, zspec > 1.2 which shows that a simple red IRAC colour cut is particularly efficient at identifying high-redshift galaxies. At least one of the lower redshift galaxies is an obscured AGN, which is a population known to have red mid-infrared colours (e.g., Stern et al. 2005, 2012), and thus are a known contaminant to the simple [3.6] − [4.5] selection. We also derived spectroscopic redshifts for 14 of 31 (45%) targeted b-YHK galaxies out of which 11 have a zspec > 1.6 and 13 with zspec > 1.5. This result demonstrates the efficiency of near-infrared broad-band selection at preferentially isolating high-redshift galaxies. To our knowledge, this spectroscopic run is the first to follow-up YHK-selected galaxies and demonstrates the efficiency of the selection technique. However, it would be highly speculative in the light of this first preliminary result to derive estimates of the effectiveness of the YHK selection criterion. We were not able to derive spectroscopic redshifts for half of the targets which probably lack strong absorption/emission lines out of their faint continuum. We can not dismiss however that they could be lying at a redshift not probed by our FORS configuration.
Only three of the 12 targeted r-YHK were assigned a spectroscopic redshift, two of which are type-2 AGN. The confirmation of red galaxies at high redshift is known to be challenging since they are not expected to show strong features, especially at optical wavelengths. For example, Wuyts et al. (2009) followed-up a sample of Distant Red Galaxies (DRG; J − K > 2.3) using either deeper observations (>8 h) with VLT/FORS2 or with similar exposure times on Keck/LRIS and were able to derive spectroscopic redshifts for about 22% of their sample. Their 14 z > 2 confirmed DRG all show Lyα. Similarly, 2 of our 12 r-YHK show a Lyα emission line.
5. The radio galaxy companions
A redshift was derived for sources A, B and D. Their 2D and 1D spectra are shown in Figs. 4 and 5 respectively. Sources C and E were not targeted. As far as A′ is concerned, its proximity to A and the width of A’s emission lines made it unfeasible to extract a reliable spectroscopic redshift.
Source A was assigned a redshift of z = 2.0256 ± 0.0002 derived by fitting a Gaussian profile to the HeII emission line, a non-resonant line, therefore not affected by absorption. HeII is also the strongest emission line in this part of the spectrum. McCarthy et al. (1990) had previously assigned a redshift of z = 2.016 through optical spectroscopy while Eales & Rawlings (1996) found through near-infrared spectroscopy that the Hα line was redshifted by ~1000 km s-1. Results from Eales & Rawlings (1996) are consistent with the revised redshift derived from the FORS2 data. The McCarthy et al. (1990) redshift is however consistent with the redshift of companion B (z = 2.0171 ± 0.0004). B is the brightest source in the B-band.
Sources A, B and D of MRC 0156-252 show AGN signatures with prominent CIV, HeII and CIII] emission. Their clearly distinct continuum and emission lines (see Fig. 4) indicate that these sources are separated. The detected lines are therefore not a signature of extended halos of the radio galaxy but of individual galaxies, although extended CIV and HeII halos are commonly found in radio galaxies (Villar-Martín et al. 2007). The emission lines of source D show a spatial extension to the South however, indicating that the cloud-like extension to the South of D is associated with D and not just an additional independent source along the line of sight.
Several radio galaxies are also known to have companion AGNs. De Breuck et al. (2010) presented the Spitzer/IRAC follow-up of a sample of 70 radio galaxies and found that at least four have companions within 6″ with mid-infrared colours consistent with AGN. The spectroscopic follow-up of one of them, 7C 1756-152 at z = 1.42, showed a companion AGN, offset by 6″ from the radio galaxy (Galametz et al. 2010b).
These results, including the clumpy morphology of the radio galaxies (evident for MRC 0156-252; see Fig. 1), could be suggestive of merger-triggered AGN activity, as predicted by several models of galaxy evolution (e.g., Hopkins et al. 2008). All three AGN in MRC 0156-252 are type-2, or obscured AGN whose obscuration could be primarily caused by galaxy-scale gas and dust. The strong feedback associated with these multiple powerful AGN could rapidly expel gas from the merging central galaxy of this (proto)cluster, shutting down star formation and leading to the old, red ellipticals that we see associated with rich environments in the local universe.
Table 1 lists the redshifts and velocity dispersions of the detected emission lines of sources A, B and D. Redshifts were assigned by fitting single Gaussian profiles to the emission lines. Velocity offsets are derived relative to the HeII line of source A. The redshifts of A, B and D listed in Table A.1 correspond to the redshift derived from the HeII line. A large range of velocity shifts is observed between the different companions (i.e., hundreds of km s-1). Velocity shifts vary from a couple of hundreds to ~1300 km s-1, a result similar to the range of velocities observed among the different components of PKS 1138-262 (Kuiper et al. 2011).
Emission lines of the radio galaxy and companions.
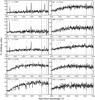 |
Fig. 5 Rest-frame UV spectra obtained with FORS2 for the ten confirmed cluster members of the galaxy structure at z = 2.02. Identification numbers from the B-band catalogue and redshift (followed by “(B)” if it is a low quality redshift) are indicated at the upper left corner of each spectrum. The spectra were rebinned by a factor of two. Sky lines are indicated by gray vertical lines. Prominent emission and absorption lines expected in this spectral range are shown by the vertical dotted lines: Lyαλ1216 (1), SiII λ1260 (2), OI/SiII (3; OS, λ1303), CII λ1334 (4), SiIV λ1402 (5), SiII λ1526 (6), CIV λ1550 (7), FeII λ1608 (8), HeII λ1640 (9), AlII λ1670 (10), SiII λ1808 (11), AlIII λ1854 (12) and CIII] λ1909 (13). The absorption/emission lines detected in each individual spectrum are marked by the red ticks and also listed in Table A.1. |
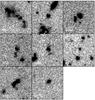 |
Fig. 6 B-band images of the radio galaxy and companions (first panel) and the seven additional spectroscopically confirmed structure members. Images are 10″ on a side, with North up and East to the left. |
6. A galaxy structure at z = 2.02
The distribution of spectroscopic redshifts in Fig. 3 clearly shows a peak at z ~ 2.02. Ten galaxies, including the radio galaxy, have redshifts within |z − 2.020| < 0.015, corresponding to velocity offsets < 1500 km s-1 relative to z = 2.020 (nine within 600 km s-1). Adopting a biweight estimator (Beers et al. 1990) for galaxy clusters with a small number of confirmed members, we estimate a line-of-sight velocity dispersion of σ ~ 580 km s-1, or ~380 km s-1 when only considering members within 1.5′. Spectra of the structure members and B-band images are shown in Figs. 5 and 6, respectively. They were all IRAC-selected galaxies; four were also selected as b-YHK galaxies. Except for the radio galaxy companions, all spectroscopically confirmed structure members are classical star-forming galaxies.
With a limited number of galaxies confirmed with spectroscopy, it is premature to draw conclusions on the nature of the galaxy structure. It could either be an already assembled, relaxed galaxy cluster or a protocluster still in formation. We will take a closer look at these possibilities below.
6.1. A large-scale structure
Figure 7 shows the spatial distribution of the structure members alongside other sources with a spectroscopic redshift from our FORS2 run. Five structure members (not including the radio galaxy companions) were found within 1 Mpc of the radio galaxy. The two other confirmed members were found at a proper distance of ~2 Mpc South/South-East of MRC 0156-252. Both G10 and G12 suggested that the galaxy structure associated with MRC 0156-252 may extend to the South East with a second overdensity of both b-YHK and IRAC-selected galaxies found 2 Mpc away from the radio galaxy (i.e., RA ~ 29.68; Dec ~ −25.05). This FORS2 spectroscopic follow-up of the structure focused on confirming cluster members near the radio galaxy and only a few high-redshift galaxy candidates were targeted in that second overdensity. However, source #662 in that structure was confirmed at z = 2.0223 which suggests this second overdensity may also be associated with the galaxy structure in which MRC 0156-252 is embedded. Since both the near-infrared and IRAC data only cover the radio galaxy surroundings and immediate South East region (G10), we do not rule out that the structure could also extend beyond our field of view.
6.2. A red sequence?
Figure 8 shows the distribution of sources in the surroundings of MRC 0156-252 in a Y − H versus Ks colour-magnitude diagram (see G10 for details on the YHKs photometry). The YHK-selected galaxies i.e., galaxy candidates at z > 1.6, show the classical bimodal distribution in colours observed for galaxies up to at least z ~ 2 (Williams et al. 2009) with two distinct populations of galaxies with blue and red near-infrared colours, isolated by design by a Y − H ~ 1.5 colour cut. We note however that the red candidates within 1 Mpc of the radio galaxy preferentially lie on a “sequence”, similar to the red sequence observed in virialized galaxy clusters. The mean of the red galaxies is Y − H ~ 1.94 with a 3σ-clipped scatter of ~0.22, a colour consistent with red sequence models at z = 2 with zf = 4 − 5 (G10).
We isolate the bright end of the potential proto-cluster red sequence i.e., galaxies with Ks < 22.5, 1.8 < Y − H < 2.3 (see Fig. 8, gray box; 14 sources) and compare its density to field surveys. We made use of the public multiwavelength catalogue of the CANDELS UDS field (Galametz et al. 2013) which contains ~36 000 sources over an area of ~200 square arcmin. The CANDELS UDS field was also imaged by VLT/HAWK-I YKs bands as well as UKIRT/WFCAM H-band (UKIDSS DR8), consistent with the VLT/HAWK-I H filter. No filter correction is therefore required. The average density of the Ks < 22.5 r-YHK-selected galaxies with 1.8 < Y − H < 2.3 derived from the UDS is 1320 ± 160 per square degree. The density of such sources in the immediate surroundings of MRC 0156-252 (i.e., <1 Mpc ~2′ at z ~ 2) is 4010 ± 1070 per square degree i.e., 3 times higher than in the field.
Apart from the radio galaxy, the brightest red candidates have a Ks ~ 21, similar to the bright end limits of the suspected red sequences of both CL J1449+0856 (at z = 2.0; Gobat et al. 2011) and IDCS J1426+3508 (z = 1.75; Stanford et al. 2012, F160W ~ 22). The only two red galaxies confirmed to reside in the Spider Web galaxy protocluster also have Ks ~ 21 (Doherty et al. 2010). These two galaxies, both confirmed from Hα emission spectroscopy, are amongst the brightest galaxies in that field in the near-infrared.
Unfortunately, we did not confirm any red candidate at z = 2.02 in the surrounding of MRC 0156-252. All spectroscopic member galaxies except the radio galaxy have very blue Y − H colours. Further spectroscopy at redder wavelengths will be necessary to confirm the presence of a red sequence in the galaxy structure.
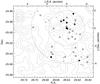 |
Fig. 7 Spatial distribution of the spectroscopic redshifts. The ten members of the structure at z = 2.02 are shown by filled circles (for high-quality redshifts) and open circles (for quality “B” zspec). The other sources with an assigned spectroscopic redshifts are shown by crosses for low-redshift (zspec < 1) galaxies and open squares for high-redshift (zspec > 1.5) galaxies. Proper distances of 1 and 2 Mpc (at z = 2.020) from the radio galaxy are shown by the dotted lines. The density contours from Fig. 2 are also included. |
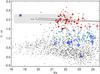 |
Fig. 8 Colour-magnitude diagram Y − H versus Ks (based on G10) of sources detected in YHKs in the environment of MRC 0156-252 (black dots). The r-YHK and b-YHK-selected galaxies are shown in red and blue circles respectively. Bigger symbols (with error bars) mark sources within 1 Mpc of the radio galaxy (at z = 2.02). Red sequence models at z = 2.02 for formation redshifts of 4 and 5 are shown by the solid lines (G10). Spectroscopically confirmed structure members (|zspec − 2.02| < 0.015) are shown by blue squares (with error bars). The radio galaxy is the bright red source with Ks ~ 18.7. The gray box designates r-YHK galaxies with Ks < 22.5 and 1.8 < Y − H < 2.3 whose density was compared to fields surveys in Sect. 6.2. The FORS2 observations did not permit us to confirm (or deny) redshifts for any of the red sequence member candidates. |
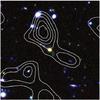 |
Fig. 9 Three-colour image of the 1′ × 1′ region around MRC 0156-252 (RGB = KsHY) with 0.2 − 6 keV X-ray “extended emission” contours overlaid in white. See Overzier et al. (2005) for details. |
6.3. X-ray extended emission from the ICM?
The field of MRC 0156-252 was imaged by Chandra (Overzier et al. 2005; O05 hereafter) for 20 ks. Along with the study of non-thermal X-ray emission from the radio galaxy core and extended emission from the radio lobes, O05 searched for evidence of extended thermal X-ray emission from a potential ICM. MRC 0156-252 was the only field in their sample of five radio galaxies at 2.0 < z < 2.6 that showed a trace of extended X-ray emission. Figure 9 shows the X-ray contours of this extended emission – obtained by smoothing the original 0.2 − 6 keV X-ray image by a 10″ FWHM Gaussian kernel after removing the X-ray counts from the radio galaxy and point sources in the field – overlaid on a 3-colour image of the 1′ × 1′ region around MRC 0156-252.
O05 estimated a tentative 2 × 10-15 erg cm-2 s-1 for the 0.5 − 2 keV unabsorbed flux for the extended emission. Similar X-ray flux estimations were derived in galaxy proto-clusters at comparable high redshifts (Tanaka et al. 2010; Papovich et al. 2010; Gobat et al. 2011), although, as for the MRC 0156-252 field, both these proto-clusters also host a number of X-ray AGN that made it challenging to estimate a reliable X-ray flux for the ICM. These estimations are still however ~5−10 times fainter than the X-ray emission in the highest redshift confirmed X-ray selected galaxy clusters (e.g., z ~ 1.6; Fassbender et al. 2011) or mid-infrared selected galaxy clusters (z = 1.75; Stanford et al. 2012) and (z ~ 1.4−1.5; Brodwin et al. 2011) which are most probably more advanced collapsed galaxy structures than the present proto-cluster.
No overdensity of red galaxies is visible at the position of the X-ray emission (Fig. 9). Although O05 also found evidence for extended X-ray emission related to inverse Compton processes in the regions covered by the extended radio structure of MRC 0156-252, these regions were excluded entirely when searching for the large-scale extended emission shown in Fig. 9. However, due to its closeness to the radio galaxy and its extension to both sides of the radio galaxy along the radio axis could indicate that inverse Compton scattering of cosmic microwave background (CMB) photons is occurring at much larger scales than those probed by the present radio morphology of MRC 0156-252. Finoguenov et al. (2010) list a sample of inverse Compton “ghosts” associated with radio jets whose X-ray fluxes are consistent with the X-ray extended emission found in the field of MRC 0156-252. Recent works also suggest that the ICM X-ray emission could also come from the far-infrared photons associated from dusty starbursts (see, e.g., Smail & Blundell 2013).
This result unfortunately shows a major limitation of the technique of searching for high-redshift galaxy clusters in the vicinity of radio galaxies since it is challenging to disentangle faint extended, thermal emission of a potential (proto-)ICM from thermal/non-thermal extended X-ray emission associated with the radio galaxy itself. No further interpretation can be made at this point. Deeper X-ray observations will be necessary to draw any firm conclusions.
We further note that high-redshift clusters often host AGN (e.g., Eastman et al. 2007; Martini et al. 2006, 2007; Galametz et al. 2009b; Pentericci et al. 2013), and even without issues such as the inverse Compton scattering of the CMB in the radio jets/lobes of radio-loud AGN, disentangling extended ICM emission from nuclear AGN X-ray emission will be a challenge for distant clusters searches in low spatial resolution surveys such as eROSITA.
7. Summary
We have used optical multi-object spectroscopy with VLT/FORS2 to target ~80 high-redshift galaxy candidates in the field of the radio galaxy MRC 0156-252 at z = 2.02.
-
We have assigned spectroscopic redshifts to 43 sources, including 32 galaxies at z > 1.5. The large majority of the confirmed high-redshift sources are starburst galaxies.
-
The spectroscopic follow-up of two close-by companions of the radio galaxy (sources B and D) showed large velocity offsets of hundreds of km s-1. They both show obscured AGN signatures. A new B-band optical image shows that MRC 0156-252 has a very clumpy morphology. Higher-resolution imaging or spectroscopy is now required to shed light on what processes are precisely occurring in the vicinity of the radio galaxy and on the possible origins of the AGN activity (e.g., merger-triggered?).
-
The spectroscopic follow-up confirmed the presence of a high-redshift galaxy structure at z = 2.02 associated with MRC 0156-252. Ten members (including sources A, B and D) were found with redshifts within |z − 2.020| <0.015, corresponding to velocity offsets <1500 km s-1 at z = 2.02. Although the small number of spectroscopically confirmed galaxy members do not permit us to draw firm conclusions regarding the precise nature of this galaxy structure, complementary pieces of evidence (i.e., analysis of a possible red sequence and X-ray data) suggest the galaxy structure associated with MRC 0156-252 is a forming galaxy cluster i.e., a proto-cluster. In particular, when selecting the bright red near-infrared selected z > 1.6 galaxy candidates with colour consistent with red sequence models at z = 2 (with zf = 4−5), the field was found ~3 times denser than control field. The distribution of the high-redshift galaxy candidates in the field shows a secondary peak in the South East, 2 Mpc away from the main clump. One galaxy in this secondary peak was spectroscopically confirmed to lie at a redshift consistent with z = 2.02 suggesting that the galaxy structure associated with MRC 0156-252 is embedded in a larger scale structure.
Online material
Appendix A: Spectroscopic redshifts
Structure members in the redshift range 2 < z < 2.03.
Other spectroscopic redshifts.
References
- Bayliss, M. B., Ashby, M. L. N., Ruel, J., et al. 2013, ApJ, submitted [arXiv:1307.2903] [Google Scholar]
- Beers, T. C., Flynn, K., & Gebhardt, K. 1990, AJ, 100, 32 [NASA ADS] [CrossRef] [Google Scholar]
- Bertin, E., & Arnouts, S. 1996, A&AS, 117, 393 [NASA ADS] [CrossRef] [EDP Sciences] [Google Scholar]
- Brodwin, M., Stern, D., Vikhlinin, A., et al. 2011, ApJ, 732, 33 [NASA ADS] [CrossRef] [Google Scholar]
- Castellano, M., Salimbeni, S., Trevese, D., et al. 2007, ApJ, 671, 1497 [Google Scholar]
- De Breuck, C., Seymour, N., Stern, D., et al. 2010, ApJ, 725, 36 [NASA ADS] [CrossRef] [Google Scholar]
- Doherty, M., Tanaka, M., De Breuck, C., et al. 2010, A&A, 509, A83 [NASA ADS] [CrossRef] [EDP Sciences] [Google Scholar]
- Eales, S. A., & Rawlings, S. 1996, ApJ, 460, 68 [NASA ADS] [CrossRef] [Google Scholar]
- Eastman, J., Martini, P., Sivakoff, G., et al. 2007, ApJ, 664, L9 [NASA ADS] [CrossRef] [Google Scholar]
- Eisenhardt, P. R. M., Brodwin, M., Gonzalez, A. H., et al. 2008, ApJ, 684, 905 [NASA ADS] [CrossRef] [Google Scholar]
- Fassbender, R., Böhringer, H., Nastasi, A., et al. 2011, New J. Phys., 13, 125014 [NASA ADS] [CrossRef] [Google Scholar]
- Fazio, G. G., Hora, J. L., Allen, L. E., et al. 2004, ApJS, 154, 10 [NASA ADS] [CrossRef] [Google Scholar]
- Finoguenov, A., Watson, M. G., Tanaka, M., et al. 2010, MNRAS, 403, 2063 [NASA ADS] [CrossRef] [Google Scholar]
- Foley, R. J., Andersson, K., Bazin, G., et al. 2011, ApJ, 731, 86 [NASA ADS] [CrossRef] [Google Scholar]
- Galametz, A., De Breuck, C., Vernet, J., et al. 2009a, A&A, 507, 131 [NASA ADS] [CrossRef] [EDP Sciences] [Google Scholar]
- Galametz, A., De Breuck, C., Vernet, J., et al. 2009b, ApJ, 694, 1309 [NASA ADS] [CrossRef] [Google Scholar]
- Galametz, A., Stern, D., Eisenhardt, P. R. M., et al. 2010a, A&A, 522, A58 [NASA ADS] [CrossRef] [EDP Sciences] [Google Scholar]
- Galametz, A., Vernet, J., De Breuck, C., et al. 2010b, A&A, 516, A101 [NASA ADS] [CrossRef] [EDP Sciences] [Google Scholar]
- Galametz, A., Stern, D., Stanford, S. A., et al. 2012, ApJ, 749, 169 [NASA ADS] [CrossRef] [Google Scholar]
- Galametz, A., Grazian, A., Fontana, A., et al. 2013, ApJS, 206, 10 [NASA ADS] [CrossRef] [Google Scholar]
- Garilli, B., Fumana, M., Franzetti, P., et al. 2010, PASP, 122, 827 [NASA ADS] [CrossRef] [Google Scholar]
- Gobat, R., Daddi, E., Onodera, M., et al. 2011, A&A, 526, A133 [NASA ADS] [CrossRef] [EDP Sciences] [Google Scholar]
- Gobat, R., Strazzullo, V., Daddi, E., et al. 2013, ApJ, 776, 9 [NASA ADS] [CrossRef] [Google Scholar]
- Hayashi, M., Kodama, T., Koyama, Y., et al. 2010, MNRAS, 402, 1980 [NASA ADS] [CrossRef] [Google Scholar]
- Hopkins, P. F., Hernquist, L., Cox, T. J., et al. 2008, ApJS, 175, 356 [NASA ADS] [CrossRef] [Google Scholar]
- Jimenez, R., & Verde, L. 2009, Phys. Rev. D, 80, 127302 [NASA ADS] [CrossRef] [Google Scholar]
- Kajisawa, M., Kodama, T., Tanaka, I., et al. 2006, MNRAS, 371, 577 [NASA ADS] [CrossRef] [Google Scholar]
- Koyama, Y., Kodama, T., Tadaki, K., et al. 2013, MNRAS, 428, 1551 [CrossRef] [Google Scholar]
- Kuiper, E., Hatch, N. A., Miley, G. K., et al. 2011, MNRAS, 415, 2245 [NASA ADS] [CrossRef] [Google Scholar]
- Kurk, J., Cimatti, A., Zamorani, G., et al. 2009, A&A, 504, 331 [NASA ADS] [CrossRef] [EDP Sciences] [Google Scholar]
- Kurk, J. D., Pentericci, L., Röttgering, H. J. A., et al. 2004, A&A, 428, 793 [NASA ADS] [CrossRef] [EDP Sciences] [Google Scholar]
- Large, M. I., Mills, B. Y., Little, A. G., et al. 1981, MNRAS, 194, 693 [NASA ADS] [CrossRef] [Google Scholar]
- Lidman, C., Rosati, P., Tanaka, M., et al. 2008, A&A, 489, 981 [NASA ADS] [CrossRef] [EDP Sciences] [Google Scholar]
- Lotz, J. M., Papovich, C., Faber, S. M., et al. 2013, ApJ, 773, 154 [NASA ADS] [CrossRef] [Google Scholar]
- Martini, P., Kelson, D. D., Kim, E., Mulchaey, J. S., & Athey, A. A. 2006, ApJ, 644, 116 [NASA ADS] [CrossRef] [Google Scholar]
- Martini, P., Mulchaey, J. S., & Kelson, D. D. 2007, ApJ, 664, 761 [NASA ADS] [CrossRef] [EDP Sciences] [Google Scholar]
- McCarthy, P. J. 1993, PASP, 105, 1051 [NASA ADS] [CrossRef] [Google Scholar]
- McCarthy, P. J., Kapahi, V. K., van Breugel, W., et al. 1990, AJ, 100, 1014 [NASA ADS] [CrossRef] [Google Scholar]
- McCarthy, P. J., Persson, S. E., & West, S. C. 1992, ApJ, 386, 52 [NASA ADS] [CrossRef] [Google Scholar]
- Nastasi, A., Fassbender, R., Böhringer, H., et al. 2011, A&A, 532, L6 [NASA ADS] [CrossRef] [EDP Sciences] [Google Scholar]
- Overzier, R. A., Harris, D. E., Carilli, C. L., et al. 2005, A&A, 433, 87 [NASA ADS] [CrossRef] [EDP Sciences] [Google Scholar]
- Overzier, R. A., Bouwens, R. J., Cross, N. J. G., et al. 2008, ApJ, 673, 143 [NASA ADS] [CrossRef] [Google Scholar]
- Papovich, C. 2008, ApJ, 676, 206 [NASA ADS] [CrossRef] [Google Scholar]
- Papovich, C., Momcheva, I., Willmer, C. N. A., et al. 2010, ApJ, 716, 1503 [NASA ADS] [CrossRef] [Google Scholar]
- Pentericci, L., Röttgering, H. J. A., Miley, G. K., et al. 1999, A&A, 341, 329 [NASA ADS] [Google Scholar]
- Pentericci, L., Kurk, J. D., Röttgering, H. J. A., et al. 2000, A&A, 361, L25 [NASA ADS] [Google Scholar]
- Pentericci, L., McCarthy, P. J., Röttgering, H. J. A., et al. 2001, ApJS, 135, 63 [NASA ADS] [CrossRef] [Google Scholar]
- Pentericci, L., Castellano, M., Menci, N., et al. 2013, A&A, 552, A111 [Google Scholar]
- Planck Collaboration 2013, A&A, submitted [arXiv:1303.5080] [Google Scholar]
- Seymour, N., Stern, D., De Breuck, C., et al. 2007, ApJS, 171, 353 [NASA ADS] [CrossRef] [Google Scholar]
- Smail, I., & Blundell, K. 2013, MNRAS, 434, 3246 [NASA ADS] [CrossRef] [Google Scholar]
- Stalder, B., Ruel, J., Suhada, R., et al. 2013, ApJ, 763, 93 [NASA ADS] [CrossRef] [Google Scholar]
- Stanford, S. A., Romer, A. K., Sabirli, K., et al. 2006, ApJ, 646, L13 [NASA ADS] [CrossRef] [Google Scholar]
- Stanford, S. A., Brodwin, M., Gonzalez, A. H., et al. 2012, ApJ, 753, 164 [NASA ADS] [CrossRef] [Google Scholar]
- Steidel, C. C., Adelberger, K. L., Shapley, A. E., et al. 2005, ApJ, 626, 44 [NASA ADS] [CrossRef] [Google Scholar]
- Stern, D., Eisenhardt, P., Gorjian, V., et al. 2005, ApJ, 631, 163 [NASA ADS] [CrossRef] [Google Scholar]
- Stern, D., Eisenhardt, P., Gorjian, V., et al. 2012, ApJ, 753, 30 [NASA ADS] [CrossRef] [Google Scholar]
- Tanaka, M., Assef, R. J., Benford, D. J., et al. 2007, MNRAS, 377, 1206 [NASA ADS] [CrossRef] [Google Scholar]
- Tanaka, M., Finoguenov, A., & Ueda, Y. 2010, ApJ, 716, L152 [NASA ADS] [CrossRef] [Google Scholar]
- Tanaka, M., Toft, S., Marchesini, D., et al. 2013, ApJ, 772, 113 [NASA ADS] [CrossRef] [Google Scholar]
- Tran, K.-V. H., Papovich, C., Saintonge, A., et al. 2010, ApJ, 719, L126 [CrossRef] [Google Scholar]
- Vanderlinde, K., Crawford, T. M., de Haan, T., et al. 2010, ApJ, 722, 1180 [NASA ADS] [CrossRef] [Google Scholar]
- Venemans, B. P., Röttgering, H. J. A., Overzier, R. A., et al. 2004, A&A, 424, L17 [NASA ADS] [CrossRef] [EDP Sciences] [Google Scholar]
- Venemans, B. P., Röttgering, H. J. A., Miley, G. K., et al. 2007, A&A, 461, 823 [NASA ADS] [CrossRef] [EDP Sciences] [Google Scholar]
- Villar-Martín, M., Sánchez, S. F., Humphrey, A., et al. 2007, MNRAS, 378, 416 [NASA ADS] [CrossRef] [Google Scholar]
- Williams, R. J., Quadri, R. F., Franx, M., et al. 2009, ApJ, 691, 1879 [NASA ADS] [CrossRef] [Google Scholar]
- Wuyts, S., van Dokkum, P. G., Franx, M., et al. 2009, ApJ, 706, 885 [NASA ADS] [CrossRef] [Google Scholar]
- Wylezalek, D., Galametz, A., Stern, D., et al. 2013, ApJ, 769, 79 [NASA ADS] [CrossRef] [Google Scholar]
- Zirm, A. W., Stanford, S. A., Postman, M., et al. 2008, ApJ, 680, 224 [NASA ADS] [CrossRef] [Google Scholar]
All Tables
All Figures
|
Fig. 1 The 15″ × 15″ (~125 kpc × 125 kpc at z ~ 2) immediate surroundings of MRC 0156-252 at optical and near-infrared wavelengths: B-band pre-imaging (left panel; this work) and Y (middle) and Ks (right) bands (G10). North is up; East is to the left. The two FORS2 slits dedicated to observing the different radio galaxy companions are shown in cyan (positions angles of − 55° and − 10° for the first and second mask, respectively). Radio contours from 4.7 GHz imaging by the VLA are overplotted in green (Carilli et al. 1997). The radio galaxy and companions are designated by “A”, “B”, “C”, and “D” for consistency with the notation of Pentericci et al. (2001) and G10. We introduce “A′” for the closest source to A revealed by the FORS2 B-band image and “E” for a suspected faint companion at the edge of the SW radio lobe. |
| In the text | |
|
Fig. 2 Spatial distribution of high-redshift galaxy candidates in the field of MRC 0156-252. Blue and red circles show b-YHK and r-YHK, respectively (z > 1.6 candidates; G10). Pink circles show IRAC-selected sources (z > 1.2 candidates; G12). MRC 0156-252 is shown by the green star. Density distribution of the full YHK + IRAC selected sample are shown by the dashed gray contours. The spectroscopic targets are highlighted by open black circles. Four bright, low-redshift galaxies chosen for mask alignment are shown by open black squares. We note that two have colours consistent with IRAC-selected sources which shows the possible contamination of the IRAC selection by low-redshift galaxies. |
| In the text | |
|
Fig. 3 Distribution of the available spectroscopic redshifts. The inset panel zooms in on the redshift range 2.00 < z < 2.04. The top axis indicates the corresponding velocity distribution relative to z = 2.020. |
| In the text | |
|
Fig. 4 2D spectra of the radio galaxy and close-by neighbours (inverse gray scale) corresponding to the two slits in Fig. 1 with position angles of − 55° (top; sources A and B) and −10° (bottom; source D). The vertical lines point to the position of the four detected emission lines (Lyαλ1216, CIV λ1550, HeII λ1640, CIII] λ1909) at the redshift of A. Continua of sources A, B and D are indicated by the horizontal ticks. |
| In the text | |
|
Fig. 5 Rest-frame UV spectra obtained with FORS2 for the ten confirmed cluster members of the galaxy structure at z = 2.02. Identification numbers from the B-band catalogue and redshift (followed by “(B)” if it is a low quality redshift) are indicated at the upper left corner of each spectrum. The spectra were rebinned by a factor of two. Sky lines are indicated by gray vertical lines. Prominent emission and absorption lines expected in this spectral range are shown by the vertical dotted lines: Lyαλ1216 (1), SiII λ1260 (2), OI/SiII (3; OS, λ1303), CII λ1334 (4), SiIV λ1402 (5), SiII λ1526 (6), CIV λ1550 (7), FeII λ1608 (8), HeII λ1640 (9), AlII λ1670 (10), SiII λ1808 (11), AlIII λ1854 (12) and CIII] λ1909 (13). The absorption/emission lines detected in each individual spectrum are marked by the red ticks and also listed in Table A.1. |
| In the text | |
|
Fig. 6 B-band images of the radio galaxy and companions (first panel) and the seven additional spectroscopically confirmed structure members. Images are 10″ on a side, with North up and East to the left. |
| In the text | |
|
Fig. 7 Spatial distribution of the spectroscopic redshifts. The ten members of the structure at z = 2.02 are shown by filled circles (for high-quality redshifts) and open circles (for quality “B” zspec). The other sources with an assigned spectroscopic redshifts are shown by crosses for low-redshift (zspec < 1) galaxies and open squares for high-redshift (zspec > 1.5) galaxies. Proper distances of 1 and 2 Mpc (at z = 2.020) from the radio galaxy are shown by the dotted lines. The density contours from Fig. 2 are also included. |
| In the text | |
|
Fig. 8 Colour-magnitude diagram Y − H versus Ks (based on G10) of sources detected in YHKs in the environment of MRC 0156-252 (black dots). The r-YHK and b-YHK-selected galaxies are shown in red and blue circles respectively. Bigger symbols (with error bars) mark sources within 1 Mpc of the radio galaxy (at z = 2.02). Red sequence models at z = 2.02 for formation redshifts of 4 and 5 are shown by the solid lines (G10). Spectroscopically confirmed structure members (|zspec − 2.02| < 0.015) are shown by blue squares (with error bars). The radio galaxy is the bright red source with Ks ~ 18.7. The gray box designates r-YHK galaxies with Ks < 22.5 and 1.8 < Y − H < 2.3 whose density was compared to fields surveys in Sect. 6.2. The FORS2 observations did not permit us to confirm (or deny) redshifts for any of the red sequence member candidates. |
| In the text | |
|
Fig. 9 Three-colour image of the 1′ × 1′ region around MRC 0156-252 (RGB = KsHY) with 0.2 − 6 keV X-ray “extended emission” contours overlaid in white. See Overzier et al. (2005) for details. |
| In the text | |
Current usage metrics show cumulative count of Article Views (full-text article views including HTML views, PDF and ePub downloads, according to the available data) and Abstracts Views on Vision4Press platform.
Data correspond to usage on the plateform after 2015. The current usage metrics is available 48-96 hours after online publication and is updated daily on week days.
Initial download of the metrics may take a while.