Fig. 7
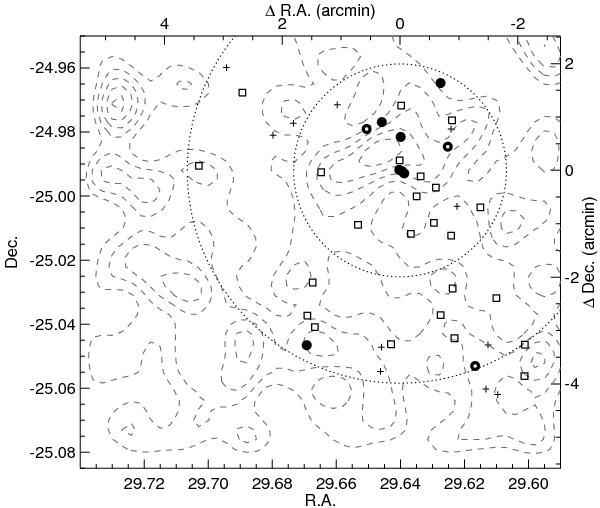
Spatial distribution of the spectroscopic redshifts. The ten members of the structure at z = 2.02 are shown by filled circles (for high-quality redshifts) and open circles (for quality “B” zspec). The other sources with an assigned spectroscopic redshifts are shown by crosses for low-redshift (zspec < 1) galaxies and open squares for high-redshift (zspec > 1.5) galaxies. Proper distances of 1 and 2 Mpc (at z = 2.020) from the radio galaxy are shown by the dotted lines. The density contours from Fig. 2 are also included.
Current usage metrics show cumulative count of Article Views (full-text article views including HTML views, PDF and ePub downloads, according to the available data) and Abstracts Views on Vision4Press platform.
Data correspond to usage on the plateform after 2015. The current usage metrics is available 48-96 hours after online publication and is updated daily on week days.
Initial download of the metrics may take a while.