Fig. 5
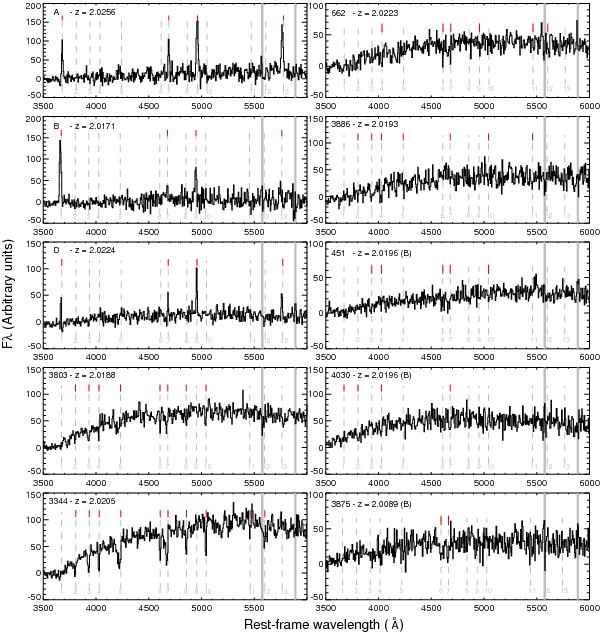
Rest-frame UV spectra obtained with FORS2 for the ten confirmed cluster members of the galaxy structure at z = 2.02. Identification numbers from the B-band catalogue and redshift (followed by “(B)” if it is a low quality redshift) are indicated at the upper left corner of each spectrum. The spectra were rebinned by a factor of two. Sky lines are indicated by gray vertical lines. Prominent emission and absorption lines expected in this spectral range are shown by the vertical dotted lines: Lyαλ1216 (1), SiII λ1260 (2), OI/SiII (3; OS, λ1303), CII λ1334 (4), SiIV λ1402 (5), SiII λ1526 (6), CIV λ1550 (7), FeII λ1608 (8), HeII λ1640 (9), AlII λ1670 (10), SiII λ1808 (11), AlIII λ1854 (12) and CIII] λ1909 (13). The absorption/emission lines detected in each individual spectrum are marked by the red ticks and also listed in Table A.1.
Current usage metrics show cumulative count of Article Views (full-text article views including HTML views, PDF and ePub downloads, according to the available data) and Abstracts Views on Vision4Press platform.
Data correspond to usage on the plateform after 2015. The current usage metrics is available 48-96 hours after online publication and is updated daily on week days.
Initial download of the metrics may take a while.