| Issue |
A&A
Volume 559, November 2013
|
|
|---|---|---|
| Article Number | A62 | |
| Number of page(s) | 8 | |
| Section | Planets and planetary systems | |
| DOI | https://doi.org/10.1051/0004-6361/201322259 | |
| Published online | 14 November 2013 | |
Growth efficiency of dust aggregates through collisions with high mass ratios⋆
1
Planetary Exploration Research Center, Chiba Institute of
Technology,
2-17-1 Tsudanuma, Narashino,
275-0016
Chiba
Japan
e-mail:
This email address is being protected from spambots. You need JavaScript enabled to view it.
2
Institute of Low Temperature Science, Hokkaido University,
060-0819
Sapporo,
Japan
3
Department of Earth and Planetary Sciences, Tokyo Institute of
Technology, Meguro-ku,
152-8511
Tokyo,
Japan
4
Department of Physics, Nagoya University,
Nagoya, 464-8602
Aichi,
Japan
5
Nagano City Museum, Hachimanpara Historical Park Ojimada-machi,
381-2212 Nagano,
Japan
6
Graduate School of Science, Kobe University,
c/o CPS (Center for Planetary
Science), Chuo-ku Minatojima Minamimachi 7-1-48, 650-0047
Kobe,
Japan
7
CPS (Center for Planetary Science), Kobe University,
Chuo-ku Minatojima Minamimachi
7-1-48, 650-0047
Kobe,
Japan
Received:
11
July
2013
Accepted:
5
September
2013
Abstract
Context. Collisional growth of dust aggregates is an essential process in forming planetesimals in protoplanetary disks, but disruption through high-velocity collisions (disruption barrier) could prohibit the dust growth. Mass transfer through very different-sized collisions has been suggested as a way to circumvent the disruption barrier.
Aims. We examine how the collisional growth efficiency of dust aggregates with different impact parameters depends on the size and the mass ratio of colliding aggregates.
Methods. We used an N-body code to numerically simulate the collisions of different-sized aggregates.
Results. Our results show that high values for the impact parameter are important and that the growth efficiency averaged over the impact parameter does not depend on the aggregate size, although the growth efficiency for nearly head-on collisions increases with size. We also find that the averaged growth efficiency tends to increase with increasing mass ratio of colliding aggregates. However, the critical collision velocity, above which the growth efficiency becomes negative, does not strongly depend on the mass ratio. These results indicate that icy dust can grow through high-velocity offset collisions at several tens of m s-1, the maximum collision velocity experienced in protoplanetary disks, whereas it is still difficult for silicate dust to grow in protoplanetary disks.
Key words: planets and satellites: formation / protoplanetary disks / methods: numerical
A complete set of our numerical results is available at the CDS via anonymous ftp to cdsarc.u-strasbg.fr (130.79.128.5) or via http://cdsarc.u-strasbg.fr/viz-bin/qcat?J/A+A/559/A62
© ESO, 2013
1. Introduction
In protoplanetary disks, planetesimals are believed to be formed from dust aggregates consisting of submicron grains. Dust aggregates should grow through collisions, but its possibility is uncertain. One of the main problems is the existence of the disruption barrier, which is caused by collisions at velocities up to several tens of m s-1 in protoplanetary disks (e.g., Adachi et al. 1976; Weidenschilling & Cuzzi 1993; Dominik et al. 2007; Blum & Wurm 2008). Considering the minimum-mass solar nebula model of Hayashi (1981), the radial inward velocity of dust reaches 50 m s-1 owing to coupling with disk gas (Adachi et al. 1976; Weidenschilling & Cuzzi 1993; Suyama et al. 2008). Even if we assume a colder disk model (Kusaka et al. 1970; Chiang & Goldreich 1997; Chiang et al. 2001; Tanaka et al. 2005), the maximum radial inward velocity is still high, ~25 m s-1. In addition, the collision velocity would be increased by the influence of gas turbulence. For example, strong gas turbulence expressed by the α model with α = 0.01 leads to velocity up to ~100 m s-1 (e.g., Cuzzi et al. 2001; Dominik et al. 2007).
Collisions between aggregates are directly simulated by N-body codes (e.g., Dominik & Tielens 1997; Paszun & Dominik 2009; Wada et al. 2009, 2011; Suyama et al. 2012; Seizinger & Kley 2013). We have been investigating the feasibility of dust growth at high-velocity collisions using an N-body code. In our simulations, fluffy aggregates represented by ballistic particle-cluster aggregation (BPCA) clusters are able to grow through collisions at velocities ucol up to ~60 m s-1 (averaged over the impact parameter) if they are of equal sizes and consist of icy particles with a radius r = 0.1 μm (Wada et al. 2009). The BPCA structure is fairly compact (fractal dimension D ~ 3), compared to ballistic cluster-cluster aggregation (BCCA) structure (D ≲ 2). Since dust aggregates are expected to be relatively compact thanks to collisional compression when they experience high-velocity collisions (Wada et al. 2008; Suyama et al. 2008) or to static compression by disk gas (Kataoka et al. 2013a,b), the growth and disruption process of BPCA clusters is particularly important for elucidating the formation process of planetesimals. Our results strongly support the formation model of icy planetesimals via direct dust growth (e.g., Okuzumi et al. 2012; Kataoka et al. 2013b).
However, the situation is much severe for silicate dust. Based on the numerical results of Wada et al. (2009), the critical collision velocity ucol,crit for silicate aggregates is given by ucol,crit ≃ 1.1(r/0.76 μm)−5/6 m s-1. This is much less than the collision velocity achieved in protoplanetary disks. Our estimation on ucol,crit for silicate aggregates is consistent with several laboratory experiments and numerical simulations for silicate aggregates (e.g., Blum & Wurm 2000, 2008; Langkowski et al. 2008; Güttler et al. 2010; Paszun & Dominik 2009; Seizinger & Kley 2013), suggesting the difficulty of silicate dust growth.
It should be noted that these results are obtained through collisions of equal-sized aggregates. In protoplanetary disks, however, collisions between different-sized dust aggregates generally would occur. As a result of numerical solutions of a coagulation equation (Smoluchowski equation) for dust growth with a realistic porosity model, Okuzumi et al. (2009) showed that collisions between different-sized dust aggregates are effective for fluffy dust to grow at an early growth stage and their prevailing mass ratio is ~10 (i.e., large dust is ten times heavier than small one). Collisions between less fluffy, similar-sized dust become dominant at the late stage. Such collisions broaden the size distribution of dust and the prevailing mass ratio is still as high as ~3−5 (Okuzumi et al. 2012).
Collisions between different-sized (mass) aggregates may increase ucol,crit since large aggregates are expected to well absorb the impact energy of small aggregates. Smoothed particle hydrodynamic (SPH) simulations suggest the increase in the critical velocity for different-sized collisions (Meru et al. 2013). Laboratory experiments report that porous aggregates consisting of micron-sized SiO2 particles can grow when they are collided onto large (flat) targets at ucol > 10 m s-1 (Wurm et al. 2005; Teiser & Wurm 2009; Paraskov et al. 2007). These experimental results suggest a positive effect of different-sized collisions on dust growth. They are obtained under head-on collisions alone, but head-on collisions are rare cases in nature. Numerical results of Wada et al. (2009) show that the critical collision velocity does not increase when offset collisions are taken into account. Teiser et al. (2011) report in their experiments that dust accretion efficiency decreases with increasing the impact angle θ, although their experiments are limited to θ < 45°. From another point of view, different-sized collisions may have an opposite effect producing much ejecta due to the injection of impact energy into a local region (Paszun & Dominik 2009). Therefore collisions between different-sized BPCA aggregates, including offset collisions, are worth investigating for discussion on dust growth. In addition, high-velocity collisions produce a large number of small aggregates as ejecta fragments (Paszun & Dominik 2009; Wada et al. 2009). Since ejecta would play an important role in dust growth and the total ejecta mass is a key to determine the mass loss rate through collisional cascades (Kobayashi & Tanaka 2010), we need a model of ejecta mass at high-velocity collisions of different-sized aggregates.
In this study, we carry out numerical simulations of collisions between icy BPCA clusters with various mass ratios (1, 16, and 64) to clarify the effect of collisions of different-sized aggregates on the critical collision velocity, taking into account offset collisions. In the next section we describe our numerical settings. The influence of different-sized collisions on the growth efficiency is presented in Sect. 3. Based on the numerical results, we discuss the feasibility of dust growth and the ejecta mass through the different-sized collisions in Sect. 4. Summary of this study is in Sect. 5.
2. Numerical model and settings
We performed 3D simulations of aggregate collisions with the numerical code developed in the previous papers (Dominik & Tielens 1997; Wada et al. 2007). We directly calculate the motion of each particle, taking into account all mechanical interactions between particles in contact. The particle interaction model is based on the elastic contact theory with surface energy, which is the so-called JKR theory (Johnson et al. 1971; Johnson 1987; Chokshi et al. 1993; Dominik & Tielens 1995, 1996). Particles are elastic spheres with the same radius and have surface energy. The details of the interaction model are described in our previous paper (Wada et al. 2007). Here, we give a brief summary of our model. The contact theory of adhesive elastic spheres determines the interactions for each degree of motion (normal motion, sliding, rolling, and twisting). Energy dissipates at the moments of contact and separation of particles due to the excitation of elastic waves. When the displacements due to sliding, rolling, and twisting exceed their elastic limits, the mechanical energy is also dissipated. The amount of energy dissipation is proportional to the critical displacements.
In this study we simulate collisions between ice aggregates rather than silicate ones to
save computational costs for a large number of simulation runs. The calculation time step is
determined by using the equilibrium overlapping length between particles divided by the
collision velocity. The overlapping length is defined as the distance
δ = 2r−d, where r is
the particle radius and d is the distance between two particles’ centers.
The overlapping length changes, of course, as a function of time, but on average, it is the
same order of magnitude as the equilibrium length
δ0 ∝ (γ/ℰ)2/3,
with γ and ℰ being the surface energy and Young’s modulus, respectively
(the equilibrium state is achieved when attractive force by surface tension balances with
repulsive force by elasticity without external force. See Wada et al. 2007 for more detail). The equilibrium length
δ0 for ice particles is larger than that for silicate by an
order of magnitude, which validates our simulations for ice aggregates with a time step ten
times longer than for silicate. Although we do not simulate collisions of silicate
aggregates, we can estimate the behavior of silicate aggregates from results of ice ones.
For example, the critical collision velocity for silicate aggregates can be estimated from
that obtained for ice, according to scaling relations such as (Wada et al. 2009)  (1)where
Eimp,crit is the critical impact energy for
growth, Ebreak is the energy for breaking a single contact
between two identical particles, and Ntotal is the total number
of particles of two aggregates. Hence, particles in this study are spheres with the material
properties of ice (the surface energy γ = 100 mJ m-2, Young’s
modulus ℰ = 7 GPa, Poisson’s ratio ν = 0.25, and the material density
ρ = 1 g cm-3) and the same radius
r = 0.1 μm. The value of surface energy for ice
particles is consistent with that measured in laboratory experiments (Gundlach et al. 2011). The critical rolling displacement is a free
parameter and we fix it to be 10 Å in this study.
(1)where
Eimp,crit is the critical impact energy for
growth, Ebreak is the energy for breaking a single contact
between two identical particles, and Ntotal is the total number
of particles of two aggregates. Hence, particles in this study are spheres with the material
properties of ice (the surface energy γ = 100 mJ m-2, Young’s
modulus ℰ = 7 GPa, Poisson’s ratio ν = 0.25, and the material density
ρ = 1 g cm-3) and the same radius
r = 0.1 μm. The value of surface energy for ice
particles is consistent with that measured in laboratory experiments (Gundlach et al. 2011). The critical rolling displacement is a free
parameter and we fix it to be 10 Å in this study.
Two colliding aggregates, projectiles and targets, are both BPCA clusters but they have different masses in the present study. The number of particles constituting projectiles, Nproj, is 500, 2000, or 8000, while that of targets, Ntarget, is 8000, 32 000, 128 000, or 512 000. Their sizes are approximately 1.5 μm (for N = 500), 2.4 μm (2000), 3.8 μm (8000), 4.8 μm (32 000), 7.7 μm (128 000), and 12 μm (512 000). Their porosity is almost the same as 86%, correspondent to the typical porosity of BPCA clusters. Using these aggregates, we examine collisions with the mass ratios Ntarget/Nproj = 1, 16, or 64 (combinations of projectiles and targets are listed in Table 1). Figure 1 shows examples of initial aggregates with the mass ratio 16 and 64.
 |
Fig. 1 Examples of initial BPCA clusters of the mass ratio Ntarget/Nproj = 16 (Ntarget = 32 000 and Nproj = 2000, left) and Ntarget/Nproj = 64 (Ntarget = 128 000 and Nproj = 2000, right). Each gray ring indicates the size of the characteristic radius of each aggregate. These aggregates collide with each other vertically at an impact parameter b with a relative velocity ucol. Here, the cases of b = 0.69bmax are shown. |
For offset collisions, these aggregates are collided with various values of the impact
parameter b, which is defined as the projected distance between the centers
of mass of the aggregates in the direction perpendicular to the collision velocity. The
maximum value of the impact parameter, bmax, is taken to be the
sum of the characteristic radii of the projectile and the target,
rc,proj and
rc,target,
 (2)The characteristic radius
is defined by the radius of gyration of an aggregate multiplied by
(2)The characteristic radius
is defined by the radius of gyration of an aggregate multiplied by
 and represents almost the apparent radius of BPCA cluster (Mukai et al. 1992, and see Fig. 1). Changing
b value from 0 (head-on collision) to bmax
(grazing collision), we see the influence of offset collisions and obtain numerical results
averaged over b as described below in Eq. (4).
and represents almost the apparent radius of BPCA cluster (Mukai et al. 1992, and see Fig. 1). Changing
b value from 0 (head-on collision) to bmax
(grazing collision), we see the influence of offset collisions and obtain numerical results
averaged over b as described below in Eq. (4).
Combinations of colliding aggregates and the obtained critical collision velocity averaged over the impact parameter
 |
Fig. 2 Initial and final snapshots of a head-on collision (b = 0) between a projectile of Nproj = 2000 and a target of Ntarget = 128 000 at ucol = 52 m s-1. Right panels show cross sectional views with particles that are painted dependent on the amount of energy dissipation as indicated in the scale bar. |
For each combination of different aggregate masses, we prepare three pairs of aggregates by randomly changing the sticking directions of particles that make up the aggregates, except for the target of Ntarget = 512 000 only one type of which is prepared to save the computational time. Then, three runs for each case of the collision velocity and the impact parameter are carried out and their numerical results are averaged for discussion except for the case of Ntarget = 512 000 (all the numerical results of 972 runs are listed in the online table, available at the CDS). All points plotted in figures and the data shown in Table 1 of the present paper represent such averages. As the aggregates we treated in this study are BPCA clusters, their shape is almost spherical and there is no significant anisotropy between them. The equal-sized collisions (i.e., Ntarget/Nproj = 1) are already done in the previous paper (Wada et al. 2009), in which the critical rolling displacement was set to 8 Å but their results would be almost the same as those with 10 Å.
We examine the size and the mass-ratio dependencies of the collisional growth efficiency
f defined by  (3)where
Nlarge is the number of particles in the largest remnant in a
collision. The growth efficiency counts how many particles, normalized by
Nproj, are gained (or lost if the value is negative) for a
target aggregate through a collision. The largest remnant mass represented by
Nlarge is dependent on the impact parameter. The largest
remnant mass averaged over the impact parameter,
(3)where
Nlarge is the number of particles in the largest remnant in a
collision. The growth efficiency counts how many particles, normalized by
Nproj, are gained (or lost if the value is negative) for a
target aggregate through a collision. The largest remnant mass represented by
Nlarge is dependent on the impact parameter. The largest
remnant mass averaged over the impact parameter,  ,
is calculated as
,
is calculated as  (4)and
the averaged growth efficiency
(4)and
the averaged growth efficiency  is given by
  .
To see disruption of ice aggregates, the collision velocity ucol
ranges from 6 to ~500 m s-1. In protoplanetary disks, the collision velocity for
the size of dust aggregates simulated in our study must be much lower than those achieved
for m-sized bodies, several tens m s-1. However, our results are applicable for
larger aggregates since our results are scaled in terms of the ratio of the kinetic energy
density to the breaking energy for single contact, i.e.,
.
To see disruption of ice aggregates, the collision velocity ucol
ranges from 6 to ~500 m s-1. In protoplanetary disks, the collision velocity for
the size of dust aggregates simulated in our study must be much lower than those achieved
for m-sized bodies, several tens m s-1. However, our results are applicable for
larger aggregates since our results are scaled in terms of the ratio of the kinetic energy
density to the breaking energy for single contact, i.e.,
 – the aggregate size does not appear in this ratio – as shown later in Sect. 4.1. Wada et al.
(2009) indicate that the growth efficiency averaged over b is
independent of the aggregate size for equal-sized collisions in the range
f > 0. In this study, therefore, we refer the
equal-sized case only for
Ntarget = Nproj = 8000 carried out
in Wada et al. (2009).
– the aggregate size does not appear in this ratio – as shown later in Sect. 4.1. Wada et al.
(2009) indicate that the growth efficiency averaged over b is
independent of the aggregate size for equal-sized collisions in the range
f > 0. In this study, therefore, we refer the
equal-sized case only for
Ntarget = Nproj = 8000 carried out
in Wada et al. (2009).
3. Results
3.1. Snapshots
Figures 2 and 3 show examples of collisions between a projectile and a target with the mass ratio 64 (Ntarget = 1280 00 and Nproj = 2000). In both cases of head-on (b = 0) and offset (b = 0.69bmax) collisions, projectiles seem to be effectively captured by target aggregates even at high-velocity (52 m s-1) collisions. At grazing impact (b ≃ bmax), the projectile passes by the target without major interaction, resulting in ejection of a small amount of fragments. As shown in cross sectional views of collision outcomes (right bottom panels of Figs. 2 and 3), the energy dissipation region is not distributed over whole target aggregates. This local dissipation mode is always observed in offset collisions and suggests that the collisional influence is limited to a region near the impact site, within a few times of a projectile size. In other words, the kinetic energy of the small projectile can be efficiently absorbed by the target so that the projectile is almost completely captured even in this high-velocity case.
3.2. Growth efficiency
Figure 4 shows the growth efficiency f = (Nlarge − Ntarget)/Nproj as a function of the impact parameter for various sets of Ntarget and Nproj. High mass loss is observed with increasing collision velocities for each set. Figure 4a presents the results for the collisions of equal-sized aggregates. Head-on collisions (b ~ 0) result in high positive f values (i.e., mass gain) while collisions with higher b result in negative f (i.e., mass loss). With further increase in b, f converges to 0 since the projectiles interact with only a small part of the targets at grazing collisions.
The growth efficiency for offset collisions ( ) mainly
depends on the mass ratio (Figs. 4b−f). With
increasing the mass ratio, the region of positive f becomes wider at each
impact velocity. In contrast, no clear trend on the aggregate size is seen (cf., panels
(b) and (c), or (e)−(f)).
) mainly
depends on the mass ratio (Figs. 4b−f). With
increasing the mass ratio, the region of positive f becomes wider at each
impact velocity. In contrast, no clear trend on the aggregate size is seen (cf., panels
(b) and (c), or (e)−(f)).
 |
Fig. 4 Growth efficiency as a function of
(b/bmax)2.
Panels a)−f) correspond to the cases of
(Nproj,Ntarget) = (8000,8000),
(2000,32 000), (8000,128 000),
(500,32 000), (2000,128 000), and
(8000,512 000), respectively. Lines in each panel show results
at various collision velocities indicated with numbers in m s-1. Since
the impact angle θ is related to b by
sinθ = b/bmax,
the horizontal axis can be read with sin2θ, instead of
|

 |
Fig. 5 Growth efficiency averaged over b as a function of
ucol for collisions with various combinations of
Nproj and Ntarget. The
shadow region of ucol = 67−90 m s-1
indicates the critical collision velocities. The scale of the upper horizontal axis
is given by |
In Fig. 5, we plot the growth efficiency
averaged over b as a function of the impact velocity
ucol for various sets of targets and projectiles. In both
equal-mass and different-mass cases,
decreases with increasing ucol and its transition from
positive to negative occurs at ucol,crit ≃ 80
m s-1 (ucol,crit for each case
is listed in Table 1). This indicates that the
maximum collision velocity for dust growth is almost independent of the mass ratio of two
colliding aggregates. In the intermediate velocity region of
20 < ucol < 70
m s-1, however,
clearly increases with the mass ratio. That is, the high mass ratio helps dust growth at
the intermediate collision velocities. Since any clear dependence on the aggregate size is
not observed in Fig. 5, the above results are
applicable to the cases with larger aggregates.
4. Discussion
4.1. Scaling formula of critical collision velocity
Here we consider a scaling relation giving ucol,crit for different-sized collisions.
For equal-sized collisions, Wada et al. (2009)
obtained a scaling relation on the critical impact energy for growth,
Eimp,crit, given by Eq. (1). Based on the so-called JKR theory (e.g.,
Chokshi et al. 1993; Wada et al. 2007), Ebreak is given by
![Mathematical equation: \begin{equation} E_{\mathrm{break}} \simeq 23\left[\gamma^{5}r^{4}\left(1-\nu^{2}\right)^{2}/\mathcal{E}^{2}\right]^{1/3}. \end{equation}](/articles/aa/full_html/2013/11/aa22259-13/aa22259-13-eq92.png) (5)Considering that
Eimp,crit at collisions of two identical
aggregates is given by
(5)Considering that
Eimp,crit at collisions of two identical
aggregates is given by  with
m being the mass of one particle, the scaling relation (1) is transformed as
with
m being the mass of one particle, the scaling relation (1) is transformed as 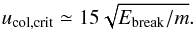 (6)This gives
ucol,crit ≃ 60(r/0.1 μm)−5/6m s-1
with the material properties of ice. When using the material properties of SiO2
(γ = 25 mJ m-2, ℰ = 54 GPa, ν = 0.17, and
ρ = 2.6 g cm-3), the above scaling relation gives
ucol,crit for silicate dust aggregates such
as
ucol,crit ≃ 6(r/0.1 μm)−5/6 m s-1.
(6)This gives
ucol,crit ≃ 60(r/0.1 μm)−5/6m s-1
with the material properties of ice. When using the material properties of SiO2
(γ = 25 mJ m-2, ℰ = 54 GPa, ν = 0.17, and
ρ = 2.6 g cm-3), the above scaling relation gives
ucol,crit for silicate dust aggregates such
as
ucol,crit ≃ 6(r/0.1 μm)−5/6 m s-1.
A scaling relation similar to that for equal-sized collisions, i.e., Eq. (6), is likely to hold in different-sized
collisions because ucol,crit is found to be
independent of Ntarget + Nproj and
Ntarget/Nproj.
From Fig. 5, in which the scale of the upper
horizontal axis is indicated with  ,
we have
,
we have  (7)and
this gives
(7)and
this gives 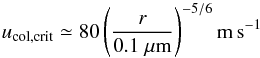 (8)for
the material properties of ice. The factor in the above equations is slightly large
compared to the equal-sized case (Eq. (6)).
This may reflect the influence of the different-sized collisions.
(8)for
the material properties of ice. The factor in the above equations is slightly large
compared to the equal-sized case (Eq. (6)).
This may reflect the influence of the different-sized collisions.
4.2. Dust growth in protoplanetary disks
We found that aggregate collisions with high mass ratios
Ntarget/Nproj
lead to high growth efficiency
averaged over b. The reason of this increase in
would be explained by the effect of head-on collisions. Head-on collisions allow for
aggregates to stick with each other more effectively than offset collisions (see Fig.
4). Experimental studies also report that head-on
collisions of porous aggregates onto large (flat) targets result in high
ucol,crit (Wurm et al. 2005; Teiser & Wurm
2009; Paraskov et al. 2007). For high
Ntarget/Nproj,
offset collisions even at relatively high impact parameter b closely
resemble head-on collisions, therefore producing high f. This effect
promotes dust growth and planetesimal formation.
In contrast, averaging over the impact parameter, the critical collision velocity for dust growth is unchanged even for collisions with a high Ntarget/Nproj = 64 (the critical velocity for ice aggregates is less than 100 m s-1). One reason for this suppression is that offset collisions, at which ejected mass becomes high, partly contribute to suppress the increase in ucol,crit. Another and probably main reason is that only the kinetic energy or the velocity of the projectile is important for the growth efficiency when the target size is sufficiently large. This is suggested by the fact that the impact energy is not distributed over a whole region of a target, limited to a region comparable to the projectile size (Figs. 2 and 3). The collision outcomes would be similar to cratering when the target size is sufficiently large.
As shown above, icy aggregates have sufficiently high
ucol,crit and the growth efficiency is
significantly enhanced at ucol ~ 50 m s-1 for
collisions with high mass ratios. These strongly support the formation model of icy
planetesimals via direct dust growth (e.g., Okuzumi et al.
2012; Kataoka et al. 2013b). For silicate
dust aggregates, on the other hand, the critical velocity for growth is estimated to be
8(r/0.1 μm)−5/6
m s-1 from the scaling relation (Eq. (7)). Since the collision velocity in protoplanetary disks could reach at least
25 m s-1, ucol,crit ≃ 8
m s-1 means that silicate aggregates cannot grow through collisions. In
contrast, the optimistic growth possibility with
ucol,crit > 20
m s-1 is inferred from experimental studies (Wurm et al. 2005; Teiser & Wurm
2009; Teiser et al. 2011; Paraskov et al. 2007). In these experiments, however,
aggregate accretion is argued based on (nearly) head-on collisions. Head-on collisions
tend to increase the growth efficiency and we can see the trend in Fig. 4, focusing on f values at
b = 0. For example, in panel (f), f around
b = 0 is still positive at ucol = 174
m s-1 and ucol,crit reaches more
than twice compared to that in Eq. (8). In
addition, comparing panels (d), (e), and (f),
ucol,crit at b = 0
increases with increasing the aggregate size. This trend is also shown at equal-mass
collisions (Wada et al. 2009). When we extrapolate
this trend, head-on collisions of larger aggregates would make
ucol,crit higher and explain the high
ucol,crit > 20
m s-1 measured in the experiments. For dust aggregates in protoplanetary
disks, however, offset collisions are dominant rather than head-on collisions and
collisions with the impact parameter  (the impact angle
θ > 45°) become important. Including
offset collisions the increase in ucol,crit
would not be significant as shown in the present study. Therefore, silicate dust is still
difficult to grow in protoplanetary disks, in which the collision velocity becomes up to
several tens of m s-1.
(the impact angle
θ > 45°) become important. Including
offset collisions the increase in ucol,crit
would not be significant as shown in the present study. Therefore, silicate dust is still
difficult to grow in protoplanetary disks, in which the collision velocity becomes up to
several tens of m s-1.
4.3. Total ejecta mass
 |
Fig. 6 Total ejecta mass averaged over b as a function of
ucol for collisions with various combinations of
Nproj and Ntarget. The
thin solid line denotes equation (9).The scale of the upper horizontal axis is given by
|
As discussed above, the net dust growth needs the condition f > 0, namely how the target or the largest remnant can survive and grow through collisions. On the other hand, small fragments or ejecta produced during collisions of dust and planetesimals would also play an important role in protoplanetary disks. For example, since the observationally-indicated lifetime of small grains are much longer than the collisional growth timescale of grains, small grains resulting form collisional fragmentation of growing grains are required to explain the dust retention in protoplanetary disks (e.g., Birnstiel et al. 2009). In addition, debris disks, gas-poor disks around stars with ages older than several million years, are composed of small grains supplied from collisional fragmentation of large bodies. The fragment production rate is mainly determined by the total ejecta mass Mej defined by Ntarget + Nproj − Nlarge (Kobayashi & Tanaka 2010). Therefore, we investigate the total ejecta mass normalized by the projectile mass Mproj(= Nproj), i.e., Mej/Mproj (= 1−f) against the collision velocity.
We plot the total ejecta mass  averaged over the impact parameter, normalized by the mass of a projectile,
Mproj, as a function of ucol
(Fig. 6). Since
Mej/Mproj is
calculated by 1 − f, Fig. 6 is
another expression of Fig. 5. We find a trend that
averaged over the impact parameter, normalized by the mass of a projectile,
Mproj, as a function of ucol
(Fig. 6). Since
Mej/Mproj is
calculated by 1 − f, Fig. 6 is
another expression of Fig. 5. We find a trend that
 is roughly proportional to ucol for various combinations of
Nproj and Ntarget although
deviates from that trend for low collision velocities. In Fig. 6, we plot a line
is roughly proportional to ucol for various combinations of
Nproj and Ntarget although
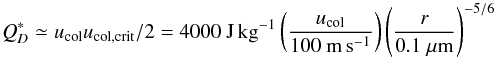
deviates from that trend for low collision velocities. In Fig. 6, we plot a line  (9)where
ucol,crit is given by 80 m s-1.
This formula roughly accounts for the data in the range
ucol > 20 m s-1. In the
lower range ucol < 20
m s-1, Mej is significantly low compared to the
formula. According to a scaling relation on the cratering process (Housen & Holsapple 2011), ejecta mass produced in cratering on
sand targets is scaled with the projectile momentum, i.e.,
Mej ∝ Mprojucol.
Therefore, collisions between different-sized aggregates can be interpreted as a cratering
process in dissipative media.
(9)where
ucol,crit is given by 80 m s-1.
This formula roughly accounts for the data in the range
ucol > 20 m s-1. In the
lower range ucol < 20
m s-1, Mej is significantly low compared to the
formula. According to a scaling relation on the cratering process (Housen & Holsapple 2011), ejecta mass produced in cratering on
sand targets is scaled with the projectile momentum, i.e.,
Mej ∝ Mprojucol.
Therefore, collisions between different-sized aggregates can be interpreted as a cratering
process in dissipative media.
For studies on the fragmentation production rate in debris disks, it is common to
introduce the specific energy  , which is
needed to break and eject the half mass of colliding bodies. From Eq. (9) and the fragmentation model by Kobayashi & Tanaka (2010), we obtain
, which is
needed to break and eject the half mass of colliding bodies. From Eq. (9) and the fragmentation model by Kobayashi & Tanaka (2010), we obtain
 (10)for
ice aggregates. Note that we obtain the formula under the assumption of unbreakable
monomers and hence Eq. (10) is valid for
ucol ≲ 1 km s-1. In debris disks,
ucol is almost independent of the grain mass and the
collisional fragmentation dominates for grains influencing disk luminosities. This
situation allows for collisional cascades to determine the mass distribution of such
grains. Since is
independent of Mproj, the differential number density is
proportional to M−11/6 with
M being grain mass (Kobayashi &
Tanaka 2010). This mass dependence is the same as the classical theory of
collisional cascade (Dohnanyi 1969; Tanaka et al. 1996). For protoplanetary disks,
ucol is not determined as simply as that for debris disks.
Collisions between small particles have
ucol ≪ ucol,crit,
while ucol is close to
ucol,crit for collisions with large
particles (e.g., Ormel & Cuzzi 2007).
Numerically solving the Smoluchowski equation (e.g., Okuzumi et al. 2012; Kobayashi et al.
2010) coupling with our result for fragmentation would be necessary to clarify
the grain mass distribution in protoplanetary disks.
(10)for
ice aggregates. Note that we obtain the formula under the assumption of unbreakable
monomers and hence Eq. (10) is valid for
ucol ≲ 1 km s-1. In debris disks,
ucol is almost independent of the grain mass and the
collisional fragmentation dominates for grains influencing disk luminosities. This
situation allows for collisional cascades to determine the mass distribution of such
grains. Since is
independent of Mproj, the differential number density is
proportional to M−11/6 with
M being grain mass (Kobayashi &
Tanaka 2010). This mass dependence is the same as the classical theory of
collisional cascade (Dohnanyi 1969; Tanaka et al. 1996). For protoplanetary disks,
ucol is not determined as simply as that for debris disks.
Collisions between small particles have
ucol ≪ ucol,crit,
while ucol is close to
ucol,crit for collisions with large
particles (e.g., Ormel & Cuzzi 2007).
Numerically solving the Smoluchowski equation (e.g., Okuzumi et al. 2012; Kobayashi et al.
2010) coupling with our result for fragmentation would be necessary to clarify
the grain mass distribution in protoplanetary disks.
5. Summary
From a point of view of the dust growth through collisions in protoplanetary disks, in particular how dust can circumvent the disruption barrier, it is important to reveal whether or not the high-velocity collisions between different-sized aggregates affect the dust growth, not only in the case of head-on collisions but also in offset collisions. We investigate the collisions of icy aggregates with various sizes, mass ratios, and impact parameters, using our N-body code simulations. As a result, our findings are as follows:
-
The growth efficiency f = (Nlarge − Ntarget)/Nproj decreases from positive to negative with increasing the impact parameter b, but its positive region is stretched with increasing the mass ratio Ntarget/Nproj. Owing to this trend, the growth efficiency averaged over b is significantly enhanced at intermediate velocities 20 < ucol < 70 m s-1, for collisions with high mass ratios. This promotes the formation of icy planetesimals via direct dust growth.
-
On the other hand, the high mass ratio does not affect significantly the critical collision velocity ucol,crit for dust growth. We show that ucol,crit results in around 80 m s-1 almost independent on the size and the mass ratio. We obtain a scaling relation
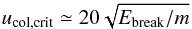 (11)with
Ebreak being the breaking energy for a pair of particles
in contact and m the monomer mass. From this scaling relation, we
obtain
(11)with
Ebreak being the breaking energy for a pair of particles
in contact and m the monomer mass. From this scaling relation, we
obtain  (12)
(12) -
It should be noted that ucol,crit for head-on collisions reaches more than twice that given in the above equations. However, if the realistic averaging over the impact parameter is done, offset collisions are dominant and head-on collisions does not contribute to the increase in ucol,crit.
-
The total ejecta mass Mej = Ntarget + Nproj − Nlarge is also examined in our simulations. We obtain a scaling relation on the ejecta mass
averaged over the impact parameter b for relatively high
ucol > 20 m s-1 as
 (13)This indicates that
the total ejecta mass is determined by the projectile’s momentum. Combining this
scaling relation with the fragmentation model of Kobayashi & Tanaka (2010), we also obtain a formula of the specific
energy for ejecting the half mass of colliding bodies,
, as
(13)This indicates that
the total ejecta mass is determined by the projectile’s momentum. Combining this
scaling relation with the fragmentation model of Kobayashi & Tanaka (2010), we also obtain a formula of the specific
energy for ejecting the half mass of colliding bodies,
, as
 (14)
(14)
in only 8 m s-1, less than the collision velocity achieved in protoplanetary disks. Although icy dust can grow through collisions and the different mass ratio helps the dust growth, another factor in dust aggregate collisions should be considered to increase the feasibility of silicate dust growth for planetesimal formation.
Acknowledgments
We thank the reviewer, Prof. Stuart Weidenschilling, for helpful comments that improved this paper. We are grateful to Dr. Takeshi Chigai for technical support on computer setup. This study was supported by the Grants-in-Aid from JSPS (21340040, 22740299, 24540459) and MEXT (23103005).
References
- Adachi, I., Hayashi, C., & Nakazawa, K. 1976, Prog. Theor. Phys., 56, 1756 [NASA ADS] [CrossRef] [Google Scholar]
- Birnstiel, T., Dullemond, C. P., & Brauer, F. 2009, A&A, 503, L5 [NASA ADS] [CrossRef] [EDP Sciences] [Google Scholar]
- Blum, J., & Wurm, G. 2000, Icarus, 143, 138 [NASA ADS] [CrossRef] [Google Scholar]
- Blum, J., & Wurm, G. 2008, ARA&A, 46, 21 [NASA ADS] [CrossRef] [EDP Sciences] [Google Scholar]
- Chiang, E. I., & Goldreich, P. 1997, ApJ, 490, 368 [NASA ADS] [CrossRef] [Google Scholar]
- Chiang, E. I., Joung, M. K., Creech-Eakman, M. J., et al. 2001, ApJ, 547, 1077 [NASA ADS] [CrossRef] [Google Scholar]
- Chokshi, A., Tielens, A. G. G. M., & Hollenbach, D. 1993, ApJ, 407, 806 [Google Scholar]
- Cuzzi, J. N., Hogan, R. C., Paque, J. M., & Dobrovolskis, A. R. 2001, ApJ, 546, 496 [NASA ADS] [CrossRef] [Google Scholar]
- Dominik, C., & Tielens, A. G. G. M. 1995, Phil. Mag. A, 72, 783 [Google Scholar]
- Dominik, C., & Tielens, A. G. G. M. 1996, Phil. Mag. A, 73, 1279 [Google Scholar]
- Dominik, C., & Tielens, A. G. G. M. 1997, ApJ, 480, 647 [NASA ADS] [CrossRef] [Google Scholar]
- Dominik, C., Blum, J., Cuzzi, J. N., & Wurm, G. 2007, in Protostars and Planets V, eds. B. Reipurth, D. Jewitt, & K. Kei (Tucson: University of Arizona Press), 783 [Google Scholar]
- Dohnanyi, J. S. 1969, J. Geophys. Res., 74, 2431 [NASA ADS] [Google Scholar]
- Gundlach, B., Kilias, S., Beitz, E., & Blum, J. 2011, Icarus, 214, 717 [NASA ADS] [CrossRef] [Google Scholar]
- Güttler, C., Blum, J., Zsom, A., Ormel, C. W., & Dullemond, C. P. 2010, A&A, 513, A56 [NASA ADS] [CrossRef] [EDP Sciences] [Google Scholar]
- Hayashi, C. 1981, Prog. Theor. Phys. Suppl., 70, 35 [NASA ADS] [CrossRef] [MathSciNet] [Google Scholar]
- Housen, K. R., & Holsapple, K. A. 2011, Icarus, 211, 856 [NASA ADS] [CrossRef] [Google Scholar]
- Johnson, K. L. 1987, Contact Mechanics (Cambridge: Cambridge Univ. Press) [Google Scholar]
- Johnson, K. L., Kendall, K., & Roberts, A. D. 1971, Proc. R. Soc. London A, 324, 301 [NASA ADS] [CrossRef] [Google Scholar]
- Kataoka, A., Tanaka, H., Okuzumi, S., & Wada, S. 2013a, A&A, 554, A4. [Google Scholar]
- Kataoka, A., Tanaka, H., Okuzumi, S., & Wada, S. 2013b, A&A, 557, L4. [NASA ADS] [CrossRef] [EDP Sciences] [Google Scholar]
- Kobayashi, H., & Tanaka, H. 2010, Icarus, 206, 735 [NASA ADS] [CrossRef] [Google Scholar]
- Kobayashi, H., Tanaka, H., Krivov, A. V., & Inaba, S. 2010, Icarus, 209, 836 [NASA ADS] [CrossRef] [Google Scholar]
- Kusaka, T., Nakano, T., & Hayashi, C. 1970, Prog. Theor. Phys., 44, 1580 [NASA ADS] [CrossRef] [Google Scholar]
- Langkowski, D., Teiser, J., & Blum, J. 2008, ApJ, 675, 764 [NASA ADS] [CrossRef] [Google Scholar]
- Meru, F., Geretshauser, R. J., Speith, R., & Kley, W. 2013, MNRAS, in press [Google Scholar]
- Mukai, T., Ishimoto, H., Kozasa, T., Blum, J., & Greenberg, J. M. 1992, A&A, 262, 315 [NASA ADS] [Google Scholar]
- Okuzumi, S., Tanaka, H., & Sakagami, M.-a. 2009, ApJ, 707, 1247 [NASA ADS] [CrossRef] [Google Scholar]
- Okuzumi, S., Tanaka, H., Kobayashi, H., & Wada, K. 2012, ApJ, 752, 106 [NASA ADS] [CrossRef] [Google Scholar]
- Ormel, C. W., & Cuzzi, J. N. 2007, A&A, 466, 413 [NASA ADS] [CrossRef] [EDP Sciences] [Google Scholar]
- Paraskov, G. B., Wurm, G., & Krauss, O. 2007, Icarus, 191, 779 [NASA ADS] [CrossRef] [Google Scholar]
- Paszun, D., & Dominik, C. 2009, A&A, 507, 1023 [NASA ADS] [CrossRef] [EDP Sciences] [Google Scholar]
- Seizinger, A., & Kley, W. 2013, A&A, 551, A65 [NASA ADS] [CrossRef] [EDP Sciences] [Google Scholar]
- Suyama, T., Wada, K., & Tanaka, H. 2008, ApJ, 684, 1310 [NASA ADS] [CrossRef] [Google Scholar]
- Suyama, T., Wada, K., Tanaka, H., & Okuzumi, S. 2012, ApJ, 753, 115 [NASA ADS] [CrossRef] [Google Scholar]
- Tanaka, H., Inaba, S., & Nakazawa, K. 1996, Icarus, 123, 450 [Google Scholar]
- Tanaka, H., Himeno, Y., & Ida, S. 2005, ApJ, 625, 414 [NASA ADS] [CrossRef] [Google Scholar]
- Tanaka, H., Wada, K., Suyama, T., & Okuzumi, S. 2012, Prog. Theor. Phys. Suppl., 195, 101 [NASA ADS] [CrossRef] [Google Scholar]
- Teiser, J., & Wurm, G. 2009, MNRAS, 393, 1584 [NASA ADS] [CrossRef] [Google Scholar]
- Teiser, J., Küpper, M., & Wurm, G. 2011, Icarus, 215, 596 [NASA ADS] [CrossRef] [Google Scholar]
- Wada, K., Tanaka, H., Suyama, T., Kimura, H., & Yamamoto, T. 2007, ApJ, 661, 320 [NASA ADS] [CrossRef] [Google Scholar]
- Wada, K., Tanaka, H., Suyama, T., Kimura, H., & Yamamoto, T. 2008, ApJ, 677, 1296 [NASA ADS] [CrossRef] [Google Scholar]
- Wada, K., Tanaka, H., Suyama, T., Kimura, H., & Yamamoto, T. 2009, ApJ, 702, 1490 [NASA ADS] [CrossRef] [Google Scholar]
- Wada, K., Tanaka, H., Suyama, T., Kimura, H., & Yamamoto, T. 2011, ApJ, 737, 36 [NASA ADS] [CrossRef] [Google Scholar]
- Weidenschilling, S. J., & Cuzzi, J. N. 1993, in Protostars and Planets III, eds. E. H. Levy, & J. I. Lunine (Tucson: University of Arizona Press), 1031 [Google Scholar]
- Wurm, G., Paraskov, G., & Krauss, O. 2005, Icarus, 178, 253 [NASA ADS] [CrossRef] [MathSciNet] [Google Scholar]
All Tables
Combinations of colliding aggregates and the obtained critical collision velocity averaged over the impact parameter
All Figures
|
Fig. 1 Examples of initial BPCA clusters of the mass ratio Ntarget/Nproj = 16 (Ntarget = 32 000 and Nproj = 2000, left) and Ntarget/Nproj = 64 (Ntarget = 128 000 and Nproj = 2000, right). Each gray ring indicates the size of the characteristic radius of each aggregate. These aggregates collide with each other vertically at an impact parameter b with a relative velocity ucol. Here, the cases of b = 0.69bmax are shown. |
| In the text | |
|
Fig. 2 Initial and final snapshots of a head-on collision (b = 0) between a projectile of Nproj = 2000 and a target of Ntarget = 128 000 at ucol = 52 m s-1. Right panels show cross sectional views with particles that are painted dependent on the amount of energy dissipation as indicated in the scale bar. |
| In the text | |
 |
Fig. 3 Same as Fig. 2 but b = 0.69bmax (an offset collision). |
| In the text | |
|
Fig. 4 Growth efficiency as a function of
(b/bmax)2.
Panels a)−f) correspond to the cases of
(Nproj,Ntarget) = (8000,8000),
(2000,32 000), (8000,128 000),
(500,32 000), (2000,128 000), and
(8000,512 000), respectively. Lines in each panel show results
at various collision velocities indicated with numbers in m s-1. Since
the impact angle θ is related to b by
sinθ = b/bmax,
the horizontal axis can be read with sin2θ, instead of
|
| In the text | |
|
Fig. 5 Growth efficiency averaged over b as a function of
ucol for collisions with various combinations of
Nproj and Ntarget. The
shadow region of ucol = 67−90 m s-1
indicates the critical collision velocities. The scale of the upper horizontal axis
is given by |
| In the text | |
|
Fig. 6 Total ejecta mass averaged over b as a function of
ucol for collisions with various combinations of
Nproj and Ntarget. The
thin solid line denotes equation (9).The scale of the upper horizontal axis is given by
|
| In the text | |
Current usage metrics show cumulative count of Article Views (full-text article views including HTML views, PDF and ePub downloads, according to the available data) and Abstracts Views on Vision4Press platform.
Data correspond to usage on the plateform after 2015. The current usage metrics is available 48-96 hours after online publication and is updated daily on week days.
Initial download of the metrics may take a while.