Fig. 5
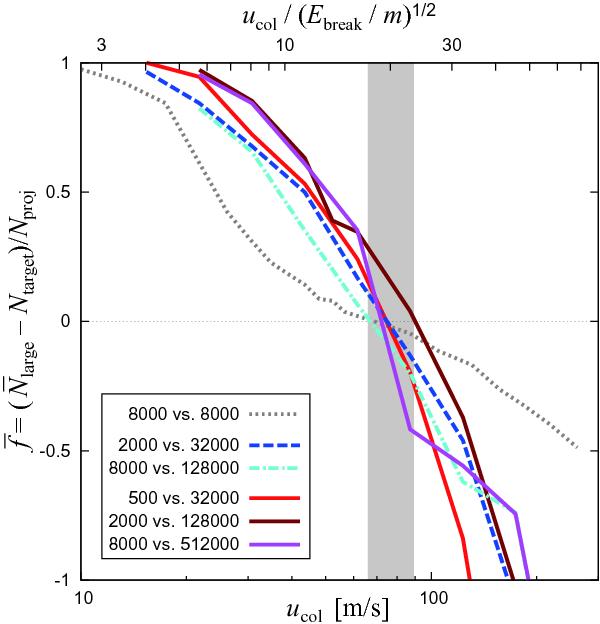
Growth efficiency averaged over b as a function of
ucol for collisions with various combinations of
Nproj and Ntarget. The
shadow region of ucol = 67−90 m s-1
indicates the critical collision velocities. The scale of the upper horizontal axis
is given by  ,
where Ebreak is the energy for breaking a single contact
and m is the monomer mass.
,
where Ebreak is the energy for breaking a single contact
and m is the monomer mass.
Current usage metrics show cumulative count of Article Views (full-text article views including HTML views, PDF and ePub downloads, according to the available data) and Abstracts Views on Vision4Press platform.
Data correspond to usage on the plateform after 2015. The current usage metrics is available 48-96 hours after online publication and is updated daily on week days.
Initial download of the metrics may take a while.