Fig. 9
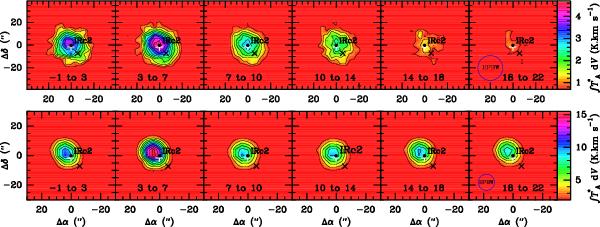
HC3N ν7-line integrated intensity maps for different velocity ranges (indicated at the bottom of each panel). Row 1 shows the transition J=12-1–11-1 with Eup = 354.2 K. The interval between contours is 0.4 K km s-1 and the lowest contour is 0.7 K km s-1. Row 2 shows the transition J = 25-1–24-1 with Eup = 462.3 K. The interval of contours is 1.5 K km s-1 and the lowest contour is 2 K km s-1. The white plus indicates the position of the hot core and the black cross the position of the compact ridge. The beam size is also shown with a blue circle. The velocity ranges 14−18 and 18−22 km s-1 show the integrated intensity contaminated by CH2CHCN since there is an overlap of this species with the line of HC3N ν7J = 25-1–24-1.
Current usage metrics show cumulative count of Article Views (full-text article views including HTML views, PDF and ePub downloads, according to the available data) and Abstracts Views on Vision4Press platform.
Data correspond to usage on the plateform after 2015. The current usage metrics is available 48-96 hours after online publication and is updated daily on week days.
Initial download of the metrics may take a while.