Free Access
Fig. 6
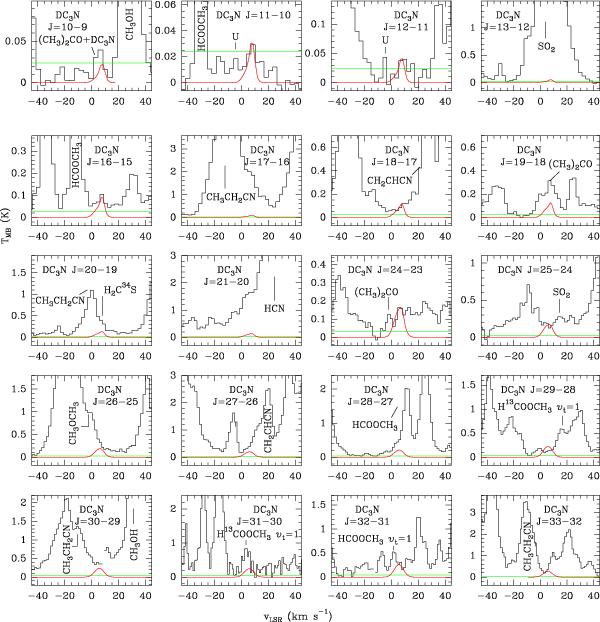
Observed spectra of DC3N (black histogram) in the IRAM survey. Best-fit LVG model results are shown in red. The horizontal green line indicates the 3σ threshold used for line identification.
Current usage metrics show cumulative count of Article Views (full-text article views including HTML views, PDF and ePub downloads, according to the available data) and Abstracts Views on Vision4Press platform.
Data correspond to usage on the plateform after 2015. The current usage metrics is available 48-96 hours after online publication and is updated daily on week days.
Initial download of the metrics may take a while.