| Issue |
A&A
Volume 559, November 2013
|
|
|---|---|---|
| Article Number | A15 | |
| Number of page(s) | 7 | |
| Section | Stellar atmospheres | |
| DOI | https://doi.org/10.1051/0004-6361/201321799 | |
| Published online | 29 October 2013 | |
Ultraviolet diagnostic of porosity-free mass-loss estimates in B stars
1
Department of Physics & Astronomy,
UCL, Gower Street,
London
WC1E 6BT,
UK
e-mail:
This email address is being protected from spambots. You need JavaScript enabled to view it.
2
Space Science Institute (SSI), 4750 Walnut St., Boulder, CO
80301,
USA
e-mail:
This email address is being protected from spambots. You need JavaScript enabled to view it.
Received: 30 April 2013
Accepted: 6 September 2013
Abstract
Aims. We seek to establish evidence in UV P Cygni line profiles that the signs of wind clumping and porosity vary with velocity. We aim to demonstrate empirically that while at most wind velocities optically thick clumps cover only a fraction of the stellar surface, close to the terminal velocity (v∞) where narrow absorption components (NACs) appear in UV lines the covering factor is approximately unity.
Methods. SEI line-synthesis models are used to determine the radial optical depths (τrad(w)) of blue and red components of the Siivλλ1400 resonance line doublet in a sample of 12 B0 to B4 supergiants. We focus on stars with well developed NACs and relatively low v∞ so that the Siiv doublet components can be treated as radiatively decoupled and formed independently.
Results. For all 12 stars the mean optical depth ratio of the blue to red components is closer to ~2 (i.e. the ratio of oscillator strengths) in the NACs than at intermediate and lower velocities. The product of mass-loss rate and ion fraction (Ṁ q(Si3 +)) calculated from the NAC optical depths is a factor of ~2 to 9 higher compared to mass-loss values sampled at ~0.4 to 0.6 v∞.
Conclusions. Since the wind effectively becomes “smooth” at the high NAC velocities and the column density is uniformly distributed over the stellar disk, the optical depths of the NACs are not seriously affected by porosity and this feature thus provides the most reliable measurement of mass-loss rate in the UV lines. Applications of this result to the weak-wind problem of late O-dwarf stars and the “P v mass loss discordance” in early O supergiants are discussed.
Key words: stars: early-type / stars: mass-loss / ultraviolet: stars / stars: atmospheres
© ESO, 2013
1. Introduction
The winds of massive stars power and enrich the interstellar medium, control the evolution of the stars, determine their ultimate fate and the nature of their remnants, determine the appearance of the Hertzsprung-Russell diagram of young, massive clusters and star-bursts, and play a major role in the initial stages of massive star cluster formation and their subsequent evolution. The sensitivity of these effects to stellar winds is especially important in view of recent developments which suggest that the mass loss rates of OB stars may be in question at the order-of-magnitude level, and not just a few % (e.g. Massa et al. 2003; Repolust et al. 2004; Bouret et al. 2005; Prinja et al. 2005; Fullerton et al. 2006; Puls et al. 2006; Cohen et al. 2006). Investigations of clumping and structures in the stellar winds are pivotal in understanding how large discrepancies between different mass loss rate determinations can arise. There are three traditional mass loss diagnostics for OB stars; all of which assume a homogeneous, spherically symmetric wind with a monotonic velocity law. These are the radio free-free emission (typically arising far out in the wind), Hα emission (primarily located near the star) and the UV wind lines (which sample the entire wind). In an ideal scenario all three diagnostics would agree. However, strong clumping in the winds can cause them to deviate from one another. Clumping can cause Hα and radio observations to overestimate mass loss rates, since both of these diagnostics contain density-squared terms. At the same time, clumping can cause the UV line absorption to underestimate mass loss (e.g. Oskinova et al. 2007).
In the present study we re-examine the effects of clumping in the measurements of mass-loss rates derived from UV resonance line profiles. Clumping leads to porosity in both velocity and space1 (e.g. Oskinova et al. 2007; Sundqvist et al. 2010; Šurlan et al. 2012) i.e. irregularities in the opacity of the wind material that covers the stellar disk at a certain velocity and accounts for the absorption that we measure. These irregularities will allow channels of reduced opacity (or increased transmission) to be present and thus distort our interpretation of the line-synthesis modelling of the UV absorption troughs. An observed wind-formed UV resonance line can be either decoded using a normal (“smooth”) line opacity and a small mass-loss rate or a small (“porosity”) line opacity and a higher mass-loss rate. In this paper we argue that the optical depths of the narrow absorption components (NACs) commonly seen in OB stars provide the most reliable (i.e. porosity-free) measure of mass-loss rate in UV resonance lines.
1.1. Narrow absorption components
Time-series UV studies of Galactic OB stars have repeatedly demonstrated that wind line profile variability may often be interpreted in terms of blueward-migrating discrete absorption components (DACs), which recur on time scales of days, and which narrow (in velocity space) as they accelerate towards the shortward profile edge (see e.g. Kaper et al. 1996; Prinja et al. 2002). Since the timescale of this UV line profile variability is (in a few case studies) cyclical and commensurate with the (maximum) rotation period of the star, this suggests an origin that is somehow connected to the stellar surface. A promising explanation for the observed cyclical variability is provided by the so-called co-rotating interaction regions (CIRs): spiral structures formed by the interaction of gas streams flowing from the stellar surface with different velocities (Mullan 1986). The formation of CIRs has been studied hydrodynamically in 2D by Cranmer & Owocki (1996) and Lobel & Blomme (2008), and in 3D by Dessart (2004). The 2D calculations also modelled the effect of the CIRs on the emergent line profiles, showing that they can reproduce the typical migrating behaviour of the DACs. They find that the optical depth enhancements are essentially caused by a velocity kink discontinuity slowly migrating outward in a fixed stellar frame.
More pertinent to the present study is that the spectroscopic end-products of the evolution of either CIRs or large scale clumps, are localised NACs, which are commonly seen in single (snapshot) UV spectrograms (e.g. Lamers et al. 1982; Howarth & Prinja 1989). The definition of a NAC adopted here is that of a narrow absorption feature that occur near the terminal velocity. While their strengths may change with time, they tend to remain fixed is velocity. Our study addresses the information that can be determined from the NACs, while acknowledging that DAC formation and propagation is far more complex (e.g. Brown et al. 2004) and beyond the scope of the current work. The surveys cited above suggest that NACs may be present, at some time, in most OB stars with well developed but unsaturated wind lines. For example, a preliminary examination of the 106 B0-B5 supergiant sample analysed by Prinja et al. (2005) indicates that NACs are evident in ~70% of the stars which exhibit well-developed, unsaturated P Cygni profiles in either Siiv or Civ.
2. The special case of NACs in decoupled SiIV λλ1394,1403 lines
The general problem with measuring mass-loss rates from UV wind lines is that the wind line variability we see is due to structures in the wind, so we can never be certain whether we are seeing a part of the wind with a covering factor of 1 (the doublet ratios verify this). On the other hand, NACs, almost by definition, are parts of the line profiles with the largest optical depth. They are formed in a region of the wind where the velocity law flattens out as it approaches the terminal velocity. As a result, all structure at radii greater than the region where the velocity is ~0.9 × terminal velocity (v∞) contribute to a very small part of velocity space. Consequently, the wind becomes “smooth” on the Sobolev length at high velocity, so column densities are uniformly distributed over the stellar disk. This requires the structures contained within a Sobolev length to cover the star, but the chances are high for that since the Sobolev length is so large. Consequently, if the covering factor is unity anywhere, it is near terminal velocity, hence the NACs.
In their study demonstrating wide-spread clumping in B supergiant winds, Prinja & Massa (2010) exploited Siiv 1400 resonance line doublets of B0 to B5 supergiants where the red and blue components of the doublet are decoupled and formed essentially independently for targets with relatively low wind terminal velocities (i.e. v∞ less than the doublet separation). The key advantage of exploiting radiatively uncoupled doublets is that these transitions arise from the same level of the same ion. Consequently, they sample exactly the same material. Therefore regardless of the total optical depth, and provided the basic assumptions of the Sobolev approximation are satisfied, the ratio of the optical depths of the doublets must be the ratio of their oscillator strengths (~2 for the Si IV 1400 doublet) unless the covering factor of the stellar disk is less than unity (see also Ganguly et al. 1999). As explained by Prinja & Massa (2010) if the ratio of the Siiv blue-to-red doublet component optical depth is less than 2 at a given velocity, the covering factor of the stellar surface by the intervening wind material at that velocity must be less than one. This applies regardless of how the column density is accumulated, i.e., whether by encountering a velocity plateau or a density enhancement.
We acknowledge however that there are two scenarios where in this context the Sobolev approximation may not be appropriate: firstly, the density (or velocity) structure of the wind over a Sobolev length may be more complex than the Sobolev approximation assumes. In that case, a more sophisticated radiative transfer code would indeed be needed to perform the calculation, including a detailed prescription of the density/velocity structure (which in unknown). Alternatively, the surfaces of constant velocity in the wind could be porous over a Sobolev length. This is indeed the interpretation adopted in the present paper. One argument that favours this conjecture is that the absorption components of wind line profiles show extremely strong temporal variability while their emission components remain relatively stable. This can be naturally explained in terms of covering factors. Further, more sophisticated theoretical investigations seem to verify this notion Sundqvist et al. (2010). Of course both of these alternatives may be present and the wind may be complicated by a variety of velocity plateaus and density variations. Nevertheless for a wind with complex density and velocity structure in the radial direction, one should expect similar structures in the lateral directions. And this lateral structure can give rise to variable covering factors less than one.
Thus we can interpret a change in the apparent doublet ratio as a function of velocity as a change in the clumping. Furthermore, when the doublet ratio is less than the ratio of the oscillator strengths, the inferred optical depth is always less than the actual optical depth. This means that derived parameters, such as the mass loss rate times the ionization fraction, Ṁ q, is always under estimated. In their line-synthesis analyses Prinja & Massa (2010) reveal that the mean ratio of τrad(w) of the blue to red Siiv components are rarely close to the canonical value of ~2 (expected from atomic constants), and instead trend toward values closer to ~1 and much less than 2. These results may be interpreted in terms of a photosphere that is partially obscured by optically thick structures in the outflowing gas.
We re-visit here the B supergiant sample of Prinja & Massa (2010) to measure the radial optical depths of the NACs separately for decoupled blue and red Siiv doublet components. We test the above notion that though the signs of clumping vary throughout the wind, the (blue-to-red) ratios of the optical depths near the NACs are closer to 2:1 (i.e. ratio of the oscillator strengths) and thus not so strongly affected by porosity effects.
B supergiant sample with decoupled Siiv profiles and clear NACs.
3. NAC radial optical depths
Our primary selection criteria were, firstly, to restrict the B supergiant sample to stars with v∞ ≲ 970 km s-1 so that the two components of the Siivλλ1393.76, 1402.77 doublet can be treated as radiatively decoupled, since the radiation from one component cannot interact with the radiation field of the other (see e.g. Prinja & Massa 2010). This sample of high-resolution IUE spectra was then further restricted to stars that exhibit clearly defined, well-developed NACs close to v∞. We rejected cases of very deep NACs which would not allow the radial optical depth (τrad(w)) to be reliably constrained. We also rejected stars with very narrow (full width at half maximum less than 0.05 v∞) NACs since the velocity width of these features is less than the resolution of the optical depth bins used in the line-synthesis; see below. Unfortunately only 6 B supergiants fit these criteria (see Table 1), so in order to increase the sample size we relaxed the criteria slightly to allow additional cases where the v∞ is ≲0.65 of the Siiv doublet separation. Thus an additional 6 stars with good NAC examples were added (Table 1). Though strictly the doublets in these additional stars can interact, this interaction is with the diffuse, scattered component due to the blue component from the far side of the star, which is still weak at the red NAC velocity and will not introduce a substantial error to the optical depths.
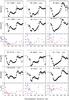 |
Fig. 1 Examples of SEI line synthesis fits (dots) to Siiv λ1393.76 (upper panels) and Siivλ1402.77 (middle panels) for our sample of B supergiants (Table 1). The lower-most panels show the corresponding radial optical depths for the blue (blue filled circles) and red (red open circles) doublet components. (Normalised velocity, w, = v/v∞.) |
As in our previous studies (e.g. Massa et al. 2003) we derived the radial optical depths from the observed Siiv line profiles by using the Sobolev with Exact Integration (SEI) method (Lamers et al. 1997), modified to allow the τrad(w) values to be determined using a histogram of 21 variable bins in velocity space. We note that Bouret et al. (2012) have recently demonstrated that the SEI method is extremely accurate for wind profiles. The SEI approach offers two key advantages for the present study: (i) it is free of assumptions of how the wind material or its ionization state are distributed, thus making it an ideal tool for empirical investigations; (ii) it is extremely fast, so that it can be used in non-linear least squares routines, where profiles must be computed hundreds of times.
Our approach is to analyse as large a number of stars as possible and then examine the resulting parameters to search for systematics. Such a goal precludes the use of more sophisticated models. Rotationally broadened IUE Siiv spectra of B dwarfs were used as the photospheric input to the SEI models. (A TLUSTY plane-parallel model atmosphere spectra, e.g. Hubeny & Lanz 1995, was adopted for the SMC star AV264.) We assume a standard “β-law” for the expansion of the wind, and set (for w = v/v∞) the initial velocity W0 = 0.01 and the extent of the optical depth for resonance lines W1 = 1. A non-linear least squares procedure is used to match the wind profiles, with the velocity law index (β) and turbulent velocity parameter (vturb) also allowed to vary. Generally in order to match the NACs well there was a tendency for v∞ to be placed very close to the shortward edge of the profile with low values of vturb. The adopted SEI model fitting parameters are listed in Table 2.
Examples of the independent SEI line profile matches to red and blue Siiv doublet components are shown in Fig. 1, where we also plot the corresponding values for τrad(w). The models generally match the observed absorption very well for the NAC region and at low velocities (typically down to ~0.3 v∞). The velocity ranges adopted for the individual NACs are listed in Table 3, and in most cases the NACs are measured in at least 3 velocity bins; nevertheless the standard deviation in τrad(w) can be quite large. The NAC blue-to-red velocity averaged optical depth ratio,  , is also given in Table 3 where it is compared to the corresponding ratio measured at lower velocity (~0.4−0.6 v∞). In all 12 B supergiant stars we note that
  is higher (and closer to ~2.0) in the NAC than at lower velocities (see Fig. 2). The difference in between the NACs and low velocity wind demonstrates two key points; (i) the signs of clumping vary as a function of velocity throughout the wind and that the stellar disk covering factor is relatively low for most of the outflow; and (ii) the ratio of optical depths in the NACs is closer to ~2:1 i.e. the ratio of f-value. The covering factor is thus ~1 at the (high) NAC velocity. This suggests that the optical depths of the NACs provide the most reliable measurement of mass-loss rate in the UV lines. Equally, we can picture that doublet SEI fits to stars in our sample would result in excellent fits to both NACs with a single set of unsaturated τrad values. However in this case, when the doublet model matches the blue component at low velocity, the model will be too shallow (in this region) for the red component. This is the tell-tale signature of porosity affecting the lower wind velocity more severely than the near-v∞ NAC.
SEI model parameters and optical depth ratios.
4. Discussion
When employing UV wind lines as mass loss diagnostics, only unsaturated wind lines are useful. However, Prinja & Massa (2010) have shown that the optical depths of apparently unsaturated wind lines may be strongly affected by porosity, causing mass loss rates derived from UV wind lines to under estimate the actual mass loss. Sundqvist et al. (2010), and Šurlan et al. (2012) have presented theoretical models for specific wind structure geometry which demonstrate how this effect can occur. In this paper, we have attempted to quantify exactly how large the effects of porosity on optical depths can be.
By considering the decoupled Siivλλ1400 blue and red doublet components of B supergiants with relatively low terminal velocity (i.e. v∞/Siiv Δsep ≲ 0.65), we have demonstrated that the blue-to-red optical depth ratios in NACs are closer to ~2 (as expected from atomic constants) than at lower wind velocities. The results indicate that while at most of the wind velocities optically thick clumps cover only a fraction of the stellar surface, in the near-v∞ NAC region the covering factor is ~unity. This implies that the NACs provide a better empirical UV measure of mass-loss rates that are not seriously affected by porosity.
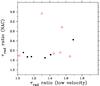 |
Fig. 2 Blue-to-red radial optical depth ratio in the NACs plotted against the corresponding ratio measured at low wind velocity (~0.4−0.6 v∞). Stars with v∞/Siiv Δsep ≲ 0.5 and ≲0.65 are plotted in black closed and red open circles, respectively. |
The SEI model fitting parameters in Table 2 were used to calculate the product of mass-loss rate and ion fraction, Ṁ q(Si3 +). Mean values determined over the NAC velocity region are listed in Table 3 for our sample stars. These estimates may be compared to Ṁ q(Si3 +) calculated at lower velocities (~0.4 to 0.6 v∞), and we also provide in Table 3 the mass-loss rates obtained from the model prescriptions of Vink et al. (2000, 2001), Ṁ(Vink). Changes of Teff or L/L⊙ resulting from a ± one spectral or luminosity bin error, would change these mass-loss rate predictions by less than a factor of 2.
It is clear that Ṁ q(Si3 +) is higher when measured in the NACs; in the “poster-child” cases of HD 13866 and HD 47240 (which have excellent NAC profiles) Ṁ q(Si3 +) is larger by factors of ~9 and 5, respectively. Further, recall that some stars in our initial sample were discarded because the NACs were saturated, so these values should be considered lower limits.
There is a second consequence of porosity that also affects derived mass loss rates. Whether NACs are due to an accumulation of clumps (Sundqvist et al. 2010; Šurlan et al. 2012) or CIR arms (see Fig. 12 in Fullerton et al. 1997) in velocity space, both models involve inhomogeneous winds. This makes interpretation of the optical depths of NACs in terms of Ṁ more complex. For a homogeneous wind, one can argue that for some combination of stellar parameters, the ion fraction of a specific element, q, must approach 1. For an inhomogeneous wind, this is no longer the case. Different ions of the same element may attain their largest ion fractions in different constituents of the wind for different stellar parameters. For example, it is possible that when q(Si2 +) ~ 1 in the denser wind structures, q(Si3 +) ~ 1 in the surrounding medium, and that when q(Si3 +) ~ 1 in the structures, q(Si4 +) ~ 1 (which lacks an observable wind line) in the surrounding medium. As a result, the maximum value of q for a given ion may only be ~1/2 or less. However, constraints can be applied to the possible ion stages present. For example, if a wind lacks strong C iv and N v lines, then most of the silicon must be in stages Si3+ and below, all of which have observable resonance lines.
Comparison of Ṁ q(Si3 +) values for NAC and low-velocity regions of the Siiv profile.
Returning to HD 13866 and HD 47240, their effective temperatures approximately correspond to the regime where q(Si3+) peaks (e.g. Prinja et al. 2005) and Si3+ may be expected to be dominant. However, the spectra of both stars have Si iiiλ1206 and C ivλλ1550 wind lines that are unsaturated at intermediate velocities and have saturated NACs. Combining the relative oscillator strengths and adunances of these lines suggests that Si iiiλ1206 and C ivλλ1550 would be 2.8 and 3.9 times stronger (respectively) than Si ivλλ1400 for the same column density of wind material. Thus, it is possible that no more than ~1/3 of the silicon is in Si3+ and that even though Ṁ q(Si3 +) in the NACs of these stars are only ~0.01 Ṁ (Vink) (Table 3), the actual mass loss rates could easily be 3 times larger. However, that is still a factor of 30 below theoretical expectations.
The UV mass-loss diagnostics discussed here can have wider applications in the (majority) cases where the resonance line doublets cannot be treated as radiatively decoupled. We can adopt the B supergiant results derived here and model just the blueward NAC in any well-defined OB star unsaturated P Cygni profile. This is feasible with our methods because we are fitting the outer region of the wind where, over a fixed velocity increment, the blue NAC region is relatively homogeneous and decoupled from the rest of the wind. An important example is the NACs seen in the Civλλ1550 and Nvλλ1240 lines of weak-wind main-sequence late O-type stars (e.g. Kaper et al. 1996). The mass-loss determinations in these weak-wind cases remain a challenge for the line-driven wind theory (e.g. Bouret et al. 2005).
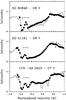 |
Fig. 3 Examples of SEI fits to the weak Civλλ1550 P Cygni doublet profile of O dwarf stars that have clearly developed blueward NACs (marked above each doublet component). (TLUSTY models were used as the photospheric input in these cases.) |
To demonstrate this application to O dwarf stars we fitted the Civ λλ1550 IUE line profiles of HD 60848 (O8 V pe var), HD 41161 (O8 V) and CPD –59 2603 (O7 V((f))). In each of these cases a well defined, relatively broad, NAC close to v∞ in weak P Cygni profiles is evident in IUE high-resolution spectra. The SEI model fits are shown in Fig. 3. Adopting from the present study that the blue NAC forms at a velocity where the stellar photosphere covering factor is ~1, the Ṁ q(C3 +) values obtained over the NAC region (~0.9 to 0.97 v∞) are ~5.5 × 10⁻¹⁰ M⊙ yr-1 (HD 60848), ~1.2 × 10⁻⁹M⊙ yr-1 (HD 41161), ~6.1 × 10⁻¹⁰M⊙ yr-1 (CPD -59 2603). These values are a factor of ~3 larger than Ṁ q(C3 +) calculated over most of the profile (i.e. ~0.2 to 0.9 v∞). An understanding of clumping as a function of wind velocity is clearly requisite for the determination of reliable mass-loss rate estimates. The UV analysis relies additionally on a description of the ion fraction which, as discussed earlier and by Sundqvist et al. (2010) or Šurlan et al. (2012), can also be affected by large scale clumping or the presence of extremely hot wind plasma (Huenemoerder et al. 2010).
Our NAC results may also help explain the “Pv discordance” in O stars. Fullerton et al. (2006) presented a compelling, independent indication of strong clumping in the wind based on the analysis of the P Cygni Pv resonance line doublet in FUSE far-UV spectra. Because phosphorus has a low cosmic abundance, this doublet never saturates in normal OB stars, providing useful estimates of mass-loss rate when P4+ is the dominant ion. These mass-loss rates are however considerably discordant with those inferred from other diagnostics such as Hα and free-free emission. The most reasonable way to resolve this difference is to invoke extreme clumping in the wind. The Galactic O supergiants examined by Fullerton et al. (2006) and also the LMC stars studied by Massa et al. (2003) generally do not exhibit NACs in their unsaturated Pv doublet lines. This absence of NACs may be explained by the ratio of ion fractions derived by Massa et al. (2003) which suggest that the massive winds in LMC O stars recombine at large radius. Stars with massive enough winds to have P v at low to intermediate velocity, recombine to P iv at high velocity, thus we do not see the NACs. Inspection of the O supergiant (Pv) sample suggests however that several of the Si iv profiles in these stars do have NACs. For stars in this sample with well-developed NACs that clearly contrast against the “underlying” P Cygni absorption, it would be worthwhile to derive Ṁ q(Si3+) values for the blue Siiv NAC since we have demonstrated here that the contrast between Ṁ from NACs and from intermediate velocity can be of order 3 to 10. A corresponding upward adjustment of the P v Ṁ estimates would then place these values closer to the Hα estimates and the theoretical predictions.
However, when addressing all of these issues in hot star winds, one must keep in mind that geometry matters. Although some progress has been made modelling the effects that of randomly distributed clumps of various shapes have on wind lines, there is compelling evidence (e.g. Kaper et al. 1996; Fullerton et al. 1997; Prinja et al. 2002) that the structure in OB winds is not random, but rather the result of CIRs. Exactly how CIR structures affect wind lines, X-rays, free-free emission and other wind diagnostics is, as yet, largely unexplored.
Throughout this paper we use the terms porous and porosity to describe the nature of a surface of constant line of sight velocity. This surface need not be simply connected spatially. For example, dense and rarefied wind structures moving with different velocities may be connected spatially but lie on different constant velocity surfaces, a property often referred to as vorocity.
Acknowledgments
Support for program HST-GO-12218 was provided by NASA through a grant from the Space Telescope Science Institute, which is operated by the Association of Universities for Research in Astronomy, Inc., under NASA contract NAS 5-26555. We thank the referee for commenting on the manuscript.
References
- Bouret, J.-C., Lanz, T., & Hillier, D. J. 2005, A&A, 438, 301 [NASA ADS] [CrossRef] [EDP Sciences] [Google Scholar]
- Bouret, J.-C., Hillier, D. J., Lanz, T., & Fullerton, A. W. 2012, A&A, 544, A67 [NASA ADS] [CrossRef] [EDP Sciences] [Google Scholar]
- Brown, J. C., Barrett, R. K., Oskinova, L. M., et al. 2004, A&A, 413, 959 [NASA ADS] [CrossRef] [EDP Sciences] [Google Scholar]
- Cohen, D. H., Leutenegger, M. A., Grizzard, K. T., et al. 2006, MNRAS, 368, 1905 [NASA ADS] [CrossRef] [Google Scholar]
- Cranmer, S. R., & Owocki, S. P. 1996, ApJ, 462, 469 [NASA ADS] [CrossRef] [Google Scholar]
- Dessart, L. 2004, A&A, 423, 693 [NASA ADS] [CrossRef] [EDP Sciences] [Google Scholar]
- Fulerton, A. W., Massa, D. L., Prinja, R. K., Owocki, S. P. & Cramner, S. R. 1997, A&A, 327, 699 [NASA ADS] [Google Scholar]
- Fullerton, A. W., Massa, D. L., & Prinja, R. K. 2006, ApJ, 637, 1025 [NASA ADS] [CrossRef] [Google Scholar]
- Ganguly, R., Eracleous, M., Charlton, J. C., & Chruchhill, C. W. 1999, AJ, 117, 2594 [NASA ADS] [CrossRef] [Google Scholar]
- Howarth, I. D., & Prinja, R. K. 1989, ApJS, 69, 527 [NASA ADS] [CrossRef] [Google Scholar]
- Hubeny, I., & Lanz, T. 1995, ApJ, 439, 875 [Google Scholar]
- Huenemoerder, D. P., Oskinova, L. M., Ignace, R., et al. 2012, ApJ, 756, L34 [NASA ADS] [CrossRef] [Google Scholar]
- Kaper, L., Henrichs, H. F., Nichols, J. S., et al. 1996, A&AS, 116, 257 [NASA ADS] [CrossRef] [EDP Sciences] [Google Scholar]
- Lamers, H. J. G. L. M., Gathier, R., & Snow, T. P., Jr. 1982, ApJ, 258, 186 [NASA ADS] [CrossRef] [Google Scholar]
- Lamers, H. J. G. L. M., Cerruti-Sola, M., & Perinotto, M. 1987, ApJ, 314, 726 [NASA ADS] [CrossRef] [Google Scholar]
- Lobel, A., & Blomme, R. 2008, ApJ, 678, 408 [NASA ADS] [CrossRef] [Google Scholar]
- Massa, D., Fullerton, A. W., Sonneborn, G., & Hutchings, J. B. 2003, ApJ, 586, 996 [NASA ADS] [CrossRef] [Google Scholar]
- Mullan, D. J. 1986, A&A, 156, 157 [NASA ADS] [Google Scholar]
- Oskinova, L. M., Hamann, W.-R., & Feldmeier, A. 2007, A&A, 476, 1331 [NASA ADS] [CrossRef] [EDP Sciences] [Google Scholar]
- Prinja, R. K., & Massa, D. 2010, A&A, 430, L55 [Google Scholar]
- Prinja, R. K., Massa, D., & Fullerton, A. W. 2002, A&A, 388, 587 [NASA ADS] [CrossRef] [EDP Sciences] [Google Scholar]
- Prinja, R. K., Massa, D., & Searle, S. C. 2005, A&A, 430, L41 [NASA ADS] [CrossRef] [EDP Sciences] [Google Scholar]
- Puls, J., Markova, N., Scuderi, S., et al. 2006, A&A, 454, 625 [NASA ADS] [CrossRef] [EDP Sciences] [Google Scholar]
- Repolust, T., Puls, J., & Herrero, A. 2004, A&A, 415, 349 [NASA ADS] [CrossRef] [EDP Sciences] [Google Scholar]
- Searle, S. C., Prinja, R. K., Massa, D., & Ryans, R. 2008, A&A, 481, 777 [NASA ADS] [CrossRef] [EDP Sciences] [Google Scholar]
- Sundqvist, J., Puls, J., & Feldmeier, A. 2010, A&A, 510, A11 [NASA ADS] [CrossRef] [EDP Sciences] [Google Scholar]
- Šurlan, B., Hamann, W.-R., Kubát, J., Oskinova, L. M. & Feldmeier, A. 2012, A&A, 541, A37 [NASA ADS] [CrossRef] [EDP Sciences] [Google Scholar]
- Trundle, C., & Lennon, D. J. 2005, A&A, 434, 677 [Google Scholar]
- Vink, J. S., de Koter, A., & Lamers, H. J. G. L. M. 2000, A&A, 362, 295 [NASA ADS] [Google Scholar]
- Vink, J. S., de Koter, A., & Lamers, H. J. G. L. M. 2001, A&A, 369, 574 [NASA ADS] [CrossRef] [EDP Sciences] [Google Scholar]
All Tables
Comparison of Ṁ q(Si3 +) values for NAC and low-velocity regions of the Siiv profile.
All Figures
|
Fig. 1 Examples of SEI line synthesis fits (dots) to Siiv λ1393.76 (upper panels) and Siivλ1402.77 (middle panels) for our sample of B supergiants (Table 1). The lower-most panels show the corresponding radial optical depths for the blue (blue filled circles) and red (red open circles) doublet components. (Normalised velocity, w, = v/v∞.) |
| In the text | |
|
Fig. 2 Blue-to-red radial optical depth ratio in the NACs plotted against the corresponding ratio measured at low wind velocity (~0.4−0.6 v∞). Stars with v∞/Siiv Δsep ≲ 0.5 and ≲0.65 are plotted in black closed and red open circles, respectively. |
| In the text | |
|
Fig. 3 Examples of SEI fits to the weak Civλλ1550 P Cygni doublet profile of O dwarf stars that have clearly developed blueward NACs (marked above each doublet component). (TLUSTY models were used as the photospheric input in these cases.) |
| In the text | |
Current usage metrics show cumulative count of Article Views (full-text article views including HTML views, PDF and ePub downloads, according to the available data) and Abstracts Views on Vision4Press platform.
Data correspond to usage on the plateform after 2015. The current usage metrics is available 48-96 hours after online publication and is updated daily on week days.
Initial download of the metrics may take a while.