| Issue |
A&A
Volume 559, November 2013
|
|
|---|---|---|
| Article Number | A101 | |
| Number of page(s) | 10 | |
| Section | Galactic structure, stellar clusters and populations | |
| DOI | https://doi.org/10.1051/0004-6361/201321469 | |
| Published online | 21 November 2013 | |
Spectroscopy of blue horizontal branch stars in NGC 6656 (M 22) ⋆,⋆⋆,⋆⋆⋆
1
Departamento de Astronomía, Universidad de
Concepción, Casilla
160-C, Concepción,
Chile
e-mail: carosalgado@udec.cl
2
Instituto de Astronomía, Universidad Católica del
Norte, Av. Angamos
0610, Antofagasta,
Chile
3
The Milky Way Millennium Nucleus, Av. Vicuña Mackenna 4860, 782-0436
Macul, Santiago,
Chile
4
Departamento de Astronomía y Astrofísica, Pontificia Universidad
Católica de Chile, Av. Vicuña
Mackenna 4860, 782-0436
Macul, Santiago,
Chile
Received:
14
March
2013
Accepted:
5
July
2013
Context. Recent investigations revealed very peculiar properties of blue horizontal branch (HB) stars in ω Centauri, which show anomalously low surface gravity and mass compared to other clusters and to theoretical models. ω Centauri, however, is a very unusual object, hosting a complex mix of multiple stellar populations with different metallicity and chemical abundances.
Aims. We measured the fundamental parameters (temperature, gravity, and surface helium abundance) of a sample of 71 blue HB stars in M 22, with the aim of clarifying if the peculiar results found in ω Cen are unique to this cluster. M 22 also hosts multiple sub-populations of stars with a spread in metallicity, analogous to ω Cen.
Methods. The stellar parameters were measured on low-resolution spectra fitting the Balmer and helium lines with a grid of synthetic spectra. From these parameters, the mass and reddening were estimated.
Results. Our results on the gravities and masses agree well with theoretical expectations, matching the previous measurements in three “normal” clusters. The anomalies found in ω Cen are not observed among our stars. A mild mass underestimate is found for stars hotter than 14 000 K, but an exact analogy with ω Cen cannot be drawn. We measured the reddening in the direction of M 22 with two independent methods, finding E(B − V) = 0.35 ± 0.02 mag, with semi-amplitude of the maximum variation Δ(E(B − V)) = 0.06 mag, and an rms intrinsic dispersion of σ(E(B − V)) = 0.03 mag.
Key words: stars: horizontal-branch / stars: atmospheres / stars: fundamental parameters / stars: abundances / globular clusters: individual: NGC 6656 (M 22)
Based on observations with the Blanco Telescope at Cerro Tololo Inter-American Observatory (CTIO), Chile (program ID CN2010B-025).
Table 1 is available in electronic form at http://www.aanda.org
Reduced spectra are only available at the CDS via anonymous ftp to cdsarc.u-strasbg.fr (130.79.128.5) or via http://cdsarc.u-strasbg.fr/viz-bin/qcat?J/A+A/559/A101
© ESO, 2013
1. Introduction
Horizontal branch (HB) stars in Galactic globular clusters (GCs) are old, low-initial mass (0.7–0.9 M⊙) stars currently burning helium in their core (Hoyle & Schwarzschild 1955; Faulkner 1966). Owing to their complexity, some aspects of the formation and internal structure of HB stars have been a matter of debate for decades (see Catelan 2009; Moni Bidin & Piotto 2010, for recent reviews). For instance, the blue extension of the HB varies among clusters, a fact primarily associated with the metallicity (Sandage & Wallerstein 1960) but not entirely explained by it (Sandage & Wildey 1967; van den Bergh 1967). A number of second parameters in addition to metallicity have been suggested to provide an explanation for this behavior, but none has proven completely adequate in describing the complex observational picture. Some examples are: stellar rotation (Peterson 1983), cluster concentration (Fusi Pecci et al. 1993), presence of super-oxygen-poor stars (Catelan & de Freitas Pacheco 1995), cluster mass (Recio-Blanco et al. 2006), environment of formation (Fraix-Burnet et al. 2009) and the cluster age (Dotter et al. 2010). Many investigations suggest that at least three parameters are required to describe the observations (e.g., Buonanno et al. 1997; Gratton et al. 2010; Dotter et al. 2010).
The preponderance of recent evidence now points towards the fact that two or more stellar generations can co-exist in the same cluster, with the younger stars being formed from material chemically enriched by the preceding generation (e.g., Piotto 2009). The most prominent case is undoubtedly ω Centauri (NGC 5139). This GC hosts a very complex mix of stellar sub-populations (Bellini et al. 2010), and its double main sequence (MS) indicates the presence of a stellar generation extremely enriched in helium (Y = 0.38, Norris 2004; Piotto et al. 2005). The helium abundance has long been proposed as a key parameter governing the cluster HB morphology (D’Antona et al. 2002; Sweigart 1997), because helium-rich HB stars are expected to be hotter than objects of canonical composition. This would in principle be consistent with the empirical correlation between HB morphology and presence of abundance anomalies that was first noted by Norris (1981) and Catelan & de Freitas Pacheco (1995). Indeed, Lee et al. (2005) claimed to have reproduced the complex HB behavior of ω Cen assuming the presence of multiple stellar populations with different helium content. However, some problems still remain because, for example, both the HB gaps and hotter end of the HB in their model are ~0.5 mag brighter than the observed data (see their Fig. 3). The helium abundance has therefore been proposed as the third parameter governing the HB morphology, after metallicity and age (Gratton et al. 2013; Villanova et al. 2012; but see also Catelan 2013). Unfortunately, cool HB stars show no helium lines suitable for abundance measurements, while diffusion processes (Michaud et al. 1983, 2008; Quievy et al. 2009) alter the surface chemical composition of HB stars hotter than the Grundahl jump (Grundahl et al. 1999). As a consequence, reliable measurements of the primordial helium abundance of HB stars are suitable only in a very narrow range of temperature (Teff = 9000–11 000 K), where no helium-enriched stars are expected in metal-poor GCs (Villanova et al. 2009, 2012). Nevertheless, an increased helium content can be indirectly deduced from other observable quantities, because He-enriched HB stars are brighter than their canonical counterparts, and occupy different loci in the temperature–gravity plane (e.g., Moehler et al. 2003; Catelan 2009; Catelan et al. 2009).
Moni Bidin et al. (2011a, hereafter MB11) measured the temperature and gravity of a large sample of blue HB stars in ω Cen, in search of indirect evidence of helium enrichment. Their measured gravities agree with the expectations for the He-enriched scenario, being systematically lower than the predictions of canonical models with solar helium abundance. However, this result cannot be straightforwardly interpreted as evidence of helium enrichment, because the resulting spectroscopic masses are unrealistically low. On the contrary, identical measurements for HB stars of three other comparison clusters revealed no such peculiarities. Hence, this behavior is so far unique to ω Cen stars, and it currently has no explanation. A link between this result and the chemical peculiarities of this cluster can possibly be established by studying other GCs showing some similarity with ω Cen.
In this paper, we investigate the properties of HB stars in M 22 (NGC 6656), measuring their fundamental parameters and comparing the results to those obtained in ω Cen (Moehler et al. 2011; Moni Bidin et al. 2011a, 2012, hereafter MB12), NGC 6752 (Moni Bidin et al. 2007, hereafter MB07), M 80 (NGC 6093) and NGC 5986 (Moni Bidin et al. 2009, hereafter MB09). M 22 is a massive, metal-poor ([Fe/H] ≈ −1.8, Marino et al. 2009) GC with an extended blue HB. It shows a multi-modal sub-giant branch (Marino et al. 2012), and ω Cen-like abundance variations but on a smaller scale (Da Costa et al. 2009), as first suggested by Hesser et al. (1977) and Norris & Freeman (1983). Revealing its chemical properties has proven difficult, because the differential reddening to the cluster is substantial, and its color-magnitude diagram (CMD) is heavily contaminated by the bulge field population. A metallicity spread among its stars was thus debated for a long time, and was eventually demonstrated by Da Costa et al. (2009) and Marino et al. (2009), along with inhomogeneities of most of the chemical elements analyzed by the authors. Very recently, Marino et al. (2013) studied a sample of seven HB stars in M 22, supporting the idea that the HB-morphology is influenced by the presence of different stellar populations. Unfortunately, we do not have any target in common with their study for a direct comparison of the results.
2. Observations and data reduction
We selected 76 stars in M 22 from the optical photometry of Monaco et al. (2004), distributed along the cluster HB from Teff ~ 7000 K to ~30 000 K. The position of the targets on the HB is presented in Fig. 1, where small dots are used to show all the sources from chip #2 of Monaco et al’s photometry, that includes the cluster central region but not all our targets. In Table 1 we give the IDs, magnitudes V, and colors (B − V) from the Monaco et al. (2004) database. The IDs are given in the form x-yyyy, where x is the chip number in Monaco et al.’s photometry, and yyyy is the star number in the corresponding catalog.
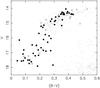 |
Fig. 1 Position of the target stars in the cluster CMD. The program stars are shown with dark filled circles, with empty circles used to indicate field objects, as discussed in the text. Grey, small dots are the cluster stars from chip #2 of Monaco et al. (2004). |
The data were collected at CTIO, during one night of observations (August 27, 2010) with the Hydra optical spectrograph mounted on the Blanco 4.0 m telescope. We used the grating KPGL1, coupled with the BG39 filter and the 200 μm slit plate, to cover a wavelength range of 3700–4900 Å with a spectral resolution of 2.7 Å. All the program stars were targeted with one fiber configuration only, and 10 fibers were allocated to the sky background. Six 1200s exposures were collected, and reduced independently. The spectra of two targets were of too low quality to be used, and they were discarded. The frames were de-biased and flat-fielded with standard IRAF1 routines, using the calibration frames collected during daytime operations. The spectra were then extracted and wavelength-calibrated with the dohydra IRAF task, by means of the arc lamp image collected in the middle of the six exposures. For each frame, the sky fibers were extracted, averaged, and subtracted from the object spectra. The spectrum of the standard star EG 274 (Hamuy et al. 1992), acquired during the same night, was used to derive the instrumental response curve. Unfortunately, this procedure failed to return the correct stellar continuum of the program stars. Since the standard star is particularly bright and its flux close to the CCD saturation, we suspect that this was due to a loss of linearity of the detector response. We therefore normalized the science spectra fitting a low-order polynomial function to the stellar continuum.
We measured the heliocentric radial velocity (RV) of the target stars through IRAF’s task fxcor, which employs the cross-correlation method described in Tonry & Davis (1979), adopting as template a synthetic spectrum of a typical HB star, with parameters similar to the program stars. The exact choice of the template is unimportant in terms of the RV measurements, because a mismatch between the template and object parameters increases the formal uncertainties but does not introduce systematic errors (Morse et al. 1991; Moni Bidin et al. 2011b). The RV of the targets was measured in each of the six spectra independently, to check for consistency. In three cases, we found large discrepancies between the measurements (>100 km s-1), incompatible with the observational errors. All the data were collected within two hours only, and binaries are rare among HB stars of GCs (Moni Bidin et al. 2006, 2008), hence these RV variations are unlikely to be real. We interpreted them as a sign of problems with the spectra, and these three stars were excluded from the analysis. The six spectra of each of the remaining 71 targets were summed. Examples of the final co-added spectra are presented in Fig. 2. The typical signal-to-noise ratio (S/N) varied from ~120 for the brightest stars to ~20 for the hottest targets. The RV of each object was eventually determined on the final co-added spectrum, whose higher quality permitted a better accuracy. The typical error deriving from the cross-correlation procedure was ≈18 km s-1. The results are provided in the last column of Table 1.
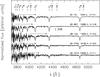 |
Fig. 2 Examples of the normalized spectra of target stars at different temperatures. The spectra were vertically shifted to avoid overlap. The Balmer and helium lines and the spectral range of each star (black arrows) used in our fitting routine are indicated. |
The RV distribution of the target stars is shown in Fig. 3. A peak is found at RV ≈ −136 km s-1, which is ~10 km s-1 higher than the nominal cluster RV (Marino et al. 2009; Peterson & Cudworth 1994). We deduce that our measurements could be affected by a systematic offset, which is still negligible compared to the resolution of our spectra (FWHM = 2.7 Å ≈ 170 km s-1). The distribution is not symmetric, because an overdensity of stars, probably a second peak, is found at RV ≈ −100 km s-1. A few objects with RV very different from the mean value (Δ(RV) > 50 km s-1) are also found on both sides of the main peak. While measurement errors could cause these very discrepant values, the asymmetry of the distribution is a clear sign of field contamination. On the other hand, given our large measurement errors and the kinematical complexity of the bulge field in the direction of M 22, the field and cluster populations cannot be easily disentangled on the basis of RV only: as shown in Fig. 3, some cluster stars are expected even at RV ~ −100 km s-1, where the field contamination apparently dominates. However, field contaminants are expected to show some peculiarity in addition to a deviating RV, because MS background stars should have higher gravity and mass and no helium depletion, while the resulting mass of field subdwarfs could be biased if their distance and/or reddening differ from the assumed cluster values. For these reasons, we cleaned the sample from field contamination by means of the following conservative criteria: basing only on RVs, we identify as field objects the stars whose RV is outside the interval −190 < RV < −80 km s-1, since Fig. 3 shows that no cluster member is expected outside this range. These are indicated with a black dot after the RV in Table 1, and a black area in the histogram of Fig. 3. The stars with −190 < RV < −160 km s-1 and −110 < RV < −80 km s-1 are flagged as “uncertain cluster membership”, indicated with a grey area in Fig. 3, and with an empty circle in Table 1. The same symbol is used to mark the stars with deviating gravity, mass, or helium abundance, as discussed in Sects. 4.1, 4.2, and 4.3, respectively. Any star whose membership is listed as uncertain twice or more is then identified as a field object. All field contaminants are marked with “F” in the last column of Table 1, indicated with empty symbols in all the figures, and excluded from the analysis.
3. Measurements
For the purpose of measuring the effective temperature, surface gravities, and helium abundance of the target stars, we fitted the hydrogen and helium lines with synthetic spectra. Stellar model atmospheres computed with ATLAS9 (Kurucz 1993) were used as input to Lemke’s version2 of the Linfor program (developed originally by Holweger, Steffen and Steenbock at Kiel University), to create a grid of synthetic spectra covering the range 7000 ≤ Teff(K) ≤ 35 000, −3.0 ≤ log N(He)/N(H) ≤ −1.0, and gravity increasing with temperature from 2.5 ≤ log g ≤ 5.0 at the cooler end to 5.0 ≤ log g ≤ 6.0 for the hotter stars. The calculation included the Balmer lines Hα to H22, four He i lines (4026 Å, 4388 Å, 4471 Å, 4922 Å), and two He ii lines (4542 Å, 4686 Å). The synthetic spectra were convoluted with a Gaussian (FWHM = 2.7 Å), to match the instrumental resolution of the data.
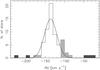 |
Fig. 3 Distribution of the measured RVs. The black areas denote the targets flagged as non-cluster members due to discrepant RV, while the grey areas indicate those whose membership is uncertain. The solid curve shows a Gaussian distribution with σ ≈ 18 km s-1 centered on RV = − 136 km s-1. |
The targets were classified in two groups, according to their temperature, to determine the set of models to be used in the fitting routine. The stars with Teff ≥ 12 500 K, as deduced by their position in the CMD, were fitted with super-solar metallicity models ([M/H] = +0.5) and variable surface helium abundance. On the other hand, the coldest targets in the sample (Teff ≤ 11 000 K) were treated with models with metallicity [M/H] = −1.5 whose helium abundance was kept fixed at the solar value. The spectra of stars across the Grundahl jump (Grundahl et al. 1999), with a color temperature in the range 11 000−12 500 K, were searched for evidence of active atmospheric diffusion. The stars presenting significant Fe ii lines in the range 4450–4600 Å (Moehler et al. 1999; MB07), or clearly lying blue-ward of the jump in the CMD, were treated as the hot group and fitted with super-solar metallicity models, while the others were fitted with metal-poor models as the cool targets.
The best fit and the derivation of the stellar parameters were established through the routines developed by Bergeron et al. (1992) and Saffer et al. (1994), as modified by Napiwotzki et al. (1999). The code normalizes the object and the synthetic spectra simultaneously using the same points for the continuum definition, and it makes use of a χ2 test, estimating the required σ from the noise in the continuum spectrum. The lines of the Balmer series from Hβ to H8 (excluding Hϵ to avoid the blended Ca ii H line), were always included in the fitting routine, along with the four He i lines for stars whose helium abundance was a free parameter. These lines were too faint in the spectra of cooler stars to be analyzed at our spectral quality and resolution. We however verified that their inclusion in the routine had no effect on the results, and that these lines were consistent with the prediction of the resulting best-fit synthetic spectrum with solar helium abundance. The hydrogen lines H9, H10, and H11, falling in the very noisy bluer range, were employed in the fit when clearly visible, usually for the cooler, brighter stars. The two He ii lines were also fitted in the spectra of stars with Teff > 30 000 K, while they were not detected for cooler targets.
The results are shown in Table 1. The fitting routine estimates the errors based only on the statistical noise of the spectrum, and other sources of uncertainty (e.g., normalization, sky-subtraction, flat-fielding) are neglected. The code thus likely underestimates the true uncertainties by a factor of 2–4 (Napiwotzki 2005, priv. comm.). We therefore multiplied the formal errors by three, to allow for a more realistic approximation of the true uncertainties. The errors thus modified are quoted in Table 1.
The stellar masses were estimated from the parameters, making use of the equation 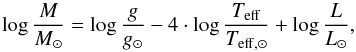 (1)where
  (2)The bolometric correction (BCV) was derived from the effective temperature through the empirical calibration of Flower (1996). We assumed T⊙ = 5777 K, log g⊙ = 4.44, (m − M)V = 13.74 ± 0.20 (Monaco et al. 2004), and Mbol, ⊙ = 4.75, because MV, ⊙ = 4.83 (Binney & Merrifield 1998) and the Flower (1996) BCV–Teff relation returns BC⊙ = −0.08. The errors in masses were derived using standard propagation theory.
4. Results
4.1. Temperatures and gravities
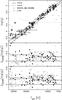 |
Fig. 4 Upper panel: position of the targets in the temperature-gravity plane. Empty and filled circles are as in Fig. 1. The canonical zero-age and terminal-age HB for canonical stars are shown with full lines, and for analogous helium-enriched (Y = 0.33) models are indicated with dashed lines. The zero-age main sequence of solar chemical composition of Salasnich et al. (2000) is shown as dotted line. Middle and lower panels: comparison of stars in M 22 (same symbols as the upper panel) and members of NGC 6752, M 80, and NGC 5986 (open, grey diamonds), and ω Cen (open, grey stars). The vertical coordinate is the difference between the stellar gravity and the corresponding value of the canonical ZAHB at the same temperature. The full and dashed curves are the same as in the upper panel. |
The location of the targets in the temperature-gravity plane is shown in the upper panel of Fig. 4. The general trend of the stars with Teff < 25 000 K (log (Teff) < 4.4) agrees well with the expectations of the canonical models. The majority of these stars are found between the canonical zero-age and terminal-age HB (ZAHB and TAHB, respectively), where helium-burning stars spend 99% of their lifetime. A mild underestimate of gravities can be seen, as the stars scatter mainly toward lower gravities. This behavior, however, was already noted by MB11 in the non-peculiar clusters NGC 6752, M 80, and NGC 5986. As an exception, five objects at the coolest end of the temperature distribution deviate from the general trend due to an excessive gravity. These are likely field MS stars, although their log (g) is lower than the expectation of the zero-age MS model shown in Fig. 4. This can be in part expected, because massive stars evolve toward lower gravities during their MS lifetime. Disregarding gravities, and assuming for each of these targets the theoretical magnitude and color of a star at the same temperature from the zero-age MS of solar chemical composition of Salasnich et al. (2000), we obtain the consistent picture where they are all foreground objects between 1.2 and 2.3 kpc from the Sun, with reddening increasing with distance, from E(B − V) = 0.09 to 0.25 mag (d = 3.2 kpc and E(B − V) = 0.38 mag for M 22, Monaco et al. 2004). They are consequently flagged as “uncertain cluster membership” objects in Table 1 and, according to the criteria given in Sect. 2, they are all eventually classified as field objects.
The gravity of the eight targets with Teff > 25 000 K is systematically lower than the model expectations. The quality of the spectra of these faint stars is low (S/N ≈ 20), and this could have induced an incorrect placement of the continuum in the normalization procedure, biasing the measurements. However, the low gravity of these objects could also indicate that they are post-helium burning stars evolving off the HB (see, e.g., Moehler et al. 2011).
In the middle and lower panel of Fig. 4, we compare the results for the program stars with previous measurements in ω Cen, NGC 6752, M 80, and NGC 5986. We adopt as vertical coordinate the difference between the measured gravity and the value of the canonical ZAHB at the corresponding temperature, ΔZAHB = log (g) − log (g)ZAHB. The plot is thus analogous to the temperature-gravity space of the upper panel, but the horizontal axis coincides with the canonical ZAHB. The plot reveals an excellent match between our results in M 22 and in the three “normal” comparison clusters, at variance with ω Cen. The mean offset of HB stars with Teff < 25 000 K in M 22 is  dex, constant in the whole temperature range. By comparison, we find
  dex in the three comparison clusters, slightly decreasing from −0.16 ± 0.02 dex for Teff ≤ 14 000 K to −0.10 ± 0.03 dex in the range 14 000–25 000 K. On the contrary, ω Cen HB stars show an offset of −0.27 ± 0.02 dex, constant with temperature, with respect to the canonical ZAHB. Hence, HB stars in M 22 do not show the low gravities observed in ω Cen, which remains a peculiarity of this extraordinary object.
4.2. Masses
The spectroscopic mass of our targets is plotted in Fig. 5 as a function of temperature, and compared to the ZAHB expectations. The masses of HB stars in GCs are well established by stellar evolution theories. In particular, they cannot be lower than the He-core mass at the helium flash (~0.47 M⊙), nor higher than the turnoff mass (~0.8 M⊙), and any result beyond these constraints evidences problematic measurements. However, it must be noted that the calculation of the mass requires the knowledge of the distance and reddening, for which we assumed the cluster values. As a consequence, the result can be highly biased for non-cluster members. We therefore identified as field contaminants (marked with a black dot after the mass column of Table 1) the eight stars with M > 1 M⊙. Five of these stars also show peculiar RV or gravity. We also note that no star among the 115 cluster members studied by (MB11) show a spectroscopic mass lower than 0.18 M⊙, despite the general large underestimate. Hence, we will conservatively flag the five objects with M < 0.1 M⊙ as “uncertain cluster membership” (marked with a circle in Table 1).
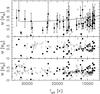 |
Fig. 5 Spectroscopic masses of the program stars (full and empty circles as in Fig. 1) as a function of temperature, compared to the expectation of the canonical ZAHB model (line in the upper panel), and to the results for NGC 6752, M 80, and NGC 5986 (grey diamonds in the middle panel), and ω Cen (grey stars in the lower panel). |
Figure 5 reveals that the masses of HB stars in M 22 are slightly underestimated compared to theoretical expectations, but they show a good agreement with the previous estimates in NGC 6752, M 80, and NGC 5986. In fact, the average mass in M 22 and in the three comparison clusters is 0.46 ± 0.03 and 0.49 ± 0.01 M⊙ respectively, in both cases lower than the 0.57 M⊙ expected on the ZAHB. We note that a slight difference could be expected, because evolution at the blue HB always proceeds redwards, meaning that at any temperature there will certainly be stars with lower masses that originated from a hotter ZAHB position. The effect is likely small though. The trend with temperature is not the same in M 22 and in the other GCs. The masses of the stars cooler than 14 000 K are on average 0.07 ± 0.04 M⊙ higher in M 22 than in the other clusters. The theoretical expectation decreases with temperature, and the mean offset of M 22 stars with respect to the model remains constant over the full range. On the contrary, the mean mass in the three reference clusters increases, and  for stars hotter than 14 000 K, where the model expectation is 0.54 M⊙, and the average mass of M 22 stars is
  . By comparison, the average value found in ω Cen is 0.36 ± 0.01 M⊙, constant over the whole temperature range. The uncertainty in the distance modulus of M 22 can partially explain the mass underestimate, because masses higher by 0.08 M⊙ are obtained if (m − M)V is increased by 1σ = 0.2 mag. However, both the mean mass underestimate in M 22 and the different trend with temperature in the three comparison clusters are fully explained by the small offset in gravity
  discussed in Sect. 4.1, and by its different dependence on temperature.
In conclusion, the mass underestimate found in ω Cen is not observed in M 22, at least among stars cooler than 14 000 K, where the results are similar to those obtained in NGC 6752, M 80, and NGC 5986. A mild mass underestimate could still be present among stars hotter than this temperature, where the average mass of M 22 stars is intermediate between ω Cen and the other clusters. However, this small offset is fully accounted for by the lower gravities, at variance with ω Cen stars (MB11). Moreover, while the average value in this temperature range is affected by a group of stars with low mass at Teff ≈16 000 K, the general trend observed in Fig. 5 does not suggest any analogy with ω Cen.
The average mass of the eight targets hotter than 25 000 K is consistent with that of the cooler stars, and an evident underestimate is not observed. This is at variance with what we would have expected if their low gravity (Sect. 4.1) were a product of an incorrect normalization of the spectra. MB07 discovered a group of hot stars in NGC 6752 with anomalously high spectroscopic mass, which possibly occupy redder and fainter loci in the CMD. They were later identified even in M 80 (MB09) and ω Cen (MB12). So far they have been found only at Teff ≥ 25 000 K. We detect one hot star with spectroscopic mass higher than the theoretical expectations by more than 1σ, but this is neither redder nor fainter than the bulk of the HB population (V = 16.15, (B − V) = 0.06, see Fig. 1). Unfortunately, our sample comprises only eight targets in this temperature range, which is insufficient to draw firm conclusions about the presence of these high-mass objects in M 22. Their frequency is unknown, with estimates varying from 20% in ω Cen to 40% in NGC 6752, hence only 1–3 such objects would have been expected in our sample, with a non-negligible probability of a null detection.
4.3. Helium abundance
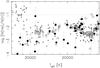 |
Fig. 6 Surface helium abundance of targets stars (empty and filled circles with error bars, as in Fig. 1), as a function of their temperature. Small, grey dots indicate the results in NGC 6752, M 80, NGC 5986, and ω Cen. The grey diamonds show the trend of helium abundance with temperature derived by MB12. The dotted line indicates the solar abundance. |
The surface helium abundance derived for our target stars is plotted in Fig. 6 as a function of the effective temperature, where we compare the results with the measurements in the other clusters. As discussed by MB12, the diffusion processes completely alter the surface abundances of blue HB stars as compared to their pre-HB values, and the same behavior is observed in all the clusters. Our measurements reveal that M 22 is no exception, and our stars closely follow the trend with temperature described in MB12. The results for the targets hotter than 20 000 K are consistent with the presence of two groups of stars, with mean abundance log (N(He)/N(H)) ≈ −2 and −3 dex respectively, as found in the other clusters (MB12), although the sample comprises too few objects to draw firm conclusions.
The helium abundance of three targets is close to the solar value, and higher by more than 2σ from the mean abundance of the other clusters, suggesting that they could be field contaminants. In fact, MS stars are usually not affected by atmospheric diffusion. Unfortunately, the temperature and gravity of these targets do not help clarify their nature, because they are found in a region of the Teff − log g plane where the ZAMS crosses the HB tracks (13 000–15 000 K, ≈4.1 dex, see Fig. 4). However, they all show discrepant RV, and the spectroscopic mass in two cases is barely compatible with the exclusion criteria defined in Sect. 4.2. These objects were flagged as “uncertain cluster membership” and, following the criteria of Sect. 2, consequently identified as field stars due to their RV.
Our sample reaches the canonical end of the HB at 32 000 K. The five hottest targets can be, within the errors, hotter than this limit, and they are therefore candidates for blue hook (BH) stars (Whitney et al. 1998; D’Cruz et al. 2000; Brown et al. 2001), whose formation cannot be explained by canonical stellar evolution theories. However, Moehler et al. (2011) showed that genuine BH objects have solar or super-solar surface helium abundance, and ω Cen BH stars are visible at the hottest end of Fig. 6, at log (N(He)/N(H)) ≈ −1. On the contrary, all our hottest targets are strongly depleted in helium (log (N(He)/N(H)) < −2), and they are therefore more likely post-helium burning stars evolving off the HB toward the white dwarf cooling sequence.
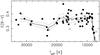 |
Fig. 7 Reddening of the program stars as a function of their temperature. Empty and filled circles are used as in Fig. 1. The solid line indicates the trend of the mean value, calculated as described in the text, with its 1σ range (dotted line). |
4.4. Reddening
The reddening of each target was estimated by comparing the observed color (B − V) with the theoretical color of a star at the same temperature and gravity. This was calculated interpolating the grid of Kurucz (1993), adopting the same metallicity as in the spectra fitting process. The results are plotted in Fig. 7, where the full and dotted lines show the trend of the mean reddening and its 1σ range, respectively. This was calculated substituting for each star the average of the five adjacent targets in order of temperature. The mean reddening of the stars hotter than 8000 K is  mag, with no trend with temperature. This result agrees well with previous measurements in the literature (Zinn 1985; Webbink 1985; Reed et al. 1988), whose mean value reported by Harris (1996, 2010 web version) is E(B − V) = 0.34 mag. In particular, our result is consistent with E(B − V) = 0.38 ± 0.02 mag found by Monaco et al. (2004), whose photometric data were employed in this work. This good agreement with previous estimates suggests that the temperature scale derived in our study is correct within 10%, because a systematic error of this magnitude would change the derived reddening by ±0.02 mag.
The stars span an interval with semiamplitude Δ(E(B − V)) = ± 0.06 mag, and the standard deviation of our measurements is σ(E(B − V)) = 0.033 mag. Quadratically subtracting the typical photometric error for our stars, and the uncertainty propagated by the errors on the parameters (~0.01 mag in both cases), we obtain an intrinsic dispersion of σ(E(B − V)) = 0.03 mag. These values are remarkably similar to those quoted by Monaco et al. (2004): σ(E(B − V)) = 0.02 and Δ(E(B − V)) = 0.06 mag. Our results agree well with Anthony-Twarog et al. (1995) and Richter et al. (1999) also, who quoted Δ(E(B − V)) = 0.07 and 0.08 mag, respectively, and with σ(E(V − I)) = 0.05 mag by Piotto & Zoccali (1999), because our measurement translates into σ(E(V − I)) = 1.34·σ(E(B − V)) = 0.04 mag by means of the transformations of Cardelli et al. (1989).
A reddening underestimate appears evident for stars cooler than ~8000 K, where  mag. Most of the targets in this temperature range are flagged as field objects, and the reddening of foreground stars could indeed be intrinsically lower. The possible gravity underestimate for MS stars discussed in Sect. 4.1 should play a minor role, because gravity has a negligible impact on the theoretical color. Nevertheless, ascribing the reddening underestimate at the coolest edge of our sample only to field contamination is unsatisfactory, because the same trend is common to all the stars, irrespective of their cluster membership status. Unfortunately, we cannot compare our results with those in the other clusters, because previous investigations did not target such cool stars, although a mild tendency toward a lower reddening is found among the coolest stars of MB07.
It is possible that the metal lines, unaccounted for in the model spectra, could be strong enough to alter the line profiles in the spectra of these cool stars, thus biasing the results. We checked this issue repeating the measurements on a high-resolution synthetic spectra with Teff = 7000–7500 K and log g = 3 dex extracted from the library of Coelho et al. (2005) and convolved with a Gaussian profile to match the resolution of our data. We indeed found a temperature underestimate of ≈10% on these spectra. However, the temperature should be increased by 2000–2500 K to increase the reddening by ~0.10 mag, and the spectroscopic mass would consequently decrease by ~0.3 M⊙ on average. This would lead to unphysical results, far from both the model expectations and the trend of the cluster stars (see Figs. 4 and 5). Hence, the reddening underestimate cannot be easily ascribed to a bias in the derived temperatures. The problem could also reside in the theoretical colors. We note that empirical calibrations of temperature-color relations show that synthetic colors from model atmospheres calculated with ATLAS9 have difficulty in properly reproducing the observations of cool stars (Ramírez & Meléndez 2005; Sekiguchi & Fukugita 2000), a problem also pointed out in the theoretical investigation by Castelli et al. (1997). Our results do not, by themselves, demonstrate the inadequacy of these models for HB stars at Teff ≈ 7000 K, but they hint that the observed reddening underestimate could be part of the same phenomenon evidenced by other authors.
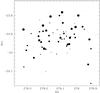 |
Fig. 8 Spatial distribution of the observed stars, where the size of each plotted point is proportional to the star’s reddening. The cross indicates the cluster’s center. |
The map of reddening in the cluster area is shown in Fig. 8. The pattern is patchy, and the data do not reveal a clear gradient. In fact, the mean reddening calculated in the N/S and E/W halves and in the four quadrants do not differ more than 1σ (≈0.015 mag). If a spatial gradient of the reddening is present, it must be small, and probably blurred by small-scale variation. This is confirmed by the inspection of the detailed map of Alonso-García et al. (2012), where they detect a clear pattern of reddening in the cluster area, but with limited variations around the mean value (≈± 0.02 mag).
4.5. Color–temperature relation
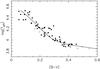 |
Fig. 9 Temperature-color relation for our target stars. Filled and empty circles are as in Fig. 1. The curve shows the best fit of the data, obtained by shifting the theoretical relation of Pietrinferni et al. (2006) and by Cassisi et al. (2009) by E(B − V) = 0.34 mag. |
The Teff − (B − V) relation resulting from our measurements is shown in Fig. 9. A quadratic fit of the data points returns the analytical expression  (3)with a residual rms in log (Teff) of 0.061 dex. A fit with the theoretical ZAHB color-temperature relation of Pietrinferni et al. (2006) and Cassisi et al. (2009) with Z = 0.001 and Y = 0.246 for the α-enhanced mixture gives an independent estimate of the cluster reddening. We thus obtained E(B − V) = 0.34 ± 0.02 mag, consistent with what we found in Sect. 4.4. The theoretical curve, shifted horizontally by 0.34 mag, reproduces the observed trend very well. MB12 detected an anomalous behavior of ω Cen HB stars in the Teff–(U − V) plane, but not in the Teff–(B − V) relation. Unfortunately, the photometric data of Monaco et al. (2004) do not include the U band, so we cannot check if this peculiarity is observed in M 22 also.
5. Conclusions
Our results on the gravities and the masses of HB stars in M 22 with Teff=7 000–25 000 K match the previous measurements in NGC 6752, M 80, and NGC 5986, which agree reasonably well with theoretical expectations. The anomalously low values found in ω Cen thus remain a peculiarity of this cluster. Hence, while recent chemical studies highlighted that the stellar content of M 22 presents many similarities with ω Cen (Marino et al. 2009, 2012), its HB stars behave like their counterparts in the other “normal” GCs. We detect a mild mass underestimate, intermediate between the results in ω Cen and in the other clusters, for our targets hotter than 14 000 K. This result is worth further investigation, but our data do not suggest a close analogy with ω Cen stars.
Five of our targets have a temperature compatible with objects hotter than the canonical end of the HB, but they all show low gravity and helium surface abundance typical of post-HB stars. We therefore fail to detect any blue hook candidate, which to date have not been found in this cluster. The point is worth further investigation because, although our sample is too small and these very hot objects are hard to identify in a highly reddened cluster such as M 22, blue hook stars have been detected in most of the massive Galactic GCs (Whitney et al. 1998; Piotto et al. 1999; D’Cruz et al. 2000; Brown et al. 2001; Rosenberg et al. 2004; Momany et al. 2004; Busso et al. 2007; Ripepi et al. 2007).
We estimated the mean cluster reddening with two independent methods, finding E(B − V) = 0.36 ± 0.02 and 0.34 ± 0.02 mag. We can therefore fix our best estimate as E(B − V) = 0.35 ± 0.02 mag. The semi-amplitude of the maximum reddening variation is Δ(E(B − V)) = ± 0.06 mag, with a rms intrinsic dispersion of σ(E(B − V)) = 0.03 mag. These spectroscopic values are in excellent agreement with previous results available in the literature, obtained from the photometric properties of cluster red giants. Within the errors of our measurements, we do not detect a clear pattern or spatial gradient of the reddening in the cluster area.
Online material
Derived parameters of the target stars.
Acknowledgments
DG and MC acknowledge support by the BASAL Center for Astrophysics and Associated Technologies (CATA) PFB-06/2007. Support for MC is also provided by the Chilean Ministry for the Economy, Development, and Tourism’s Programa Iniciativa Científica Milenio through grant P07-021-F, awarded to The Milky Way Millennium Nucleus; by Proyecto FONDECYT Regular #1110326; and by Proyecto Anillo de Investigación en Ciencia y Tecnología PIA CONICYT-ACT 86. CMB thanks Dr. Maximiliano Moyano for his technical support. SV gratefully acknowledges the support provided by FONDECYT N. 1130721. We thank the anonymous referee for his/her detailed and constructive comments.
References
- Alonso-García, J., Mateo, M., Sen, B., et al. 2012, AJ, 143, 70 [NASA ADS] [CrossRef] [Google Scholar]
- Anthony-Twarog, B. J., Twarog, B. A., & Craig, J. 1995, PASP, 107, 32 [NASA ADS] [CrossRef] [Google Scholar]
- Bellini, A., Bedin, L. R., Piotto, G., et al. 2010, AJ, 140, 631 [NASA ADS] [CrossRef] [Google Scholar]
- Bergeron, P., Saffer, R. A., & Liebert, J. 1992, ApJ, 394, 228 [NASA ADS] [CrossRef] [Google Scholar]
- Binney, J., & Merrifield, M. 1998, Galactic Astronomy (Princeton University Press) [Google Scholar]
- Brown, T. M., Sweigart, A. V., Lanz, T., Landsman, W. B., & Hubeny, I. 2001, ApJ, 562, 368 [NASA ADS] [CrossRef] [Google Scholar]
- Buonanno, R., Corsi, C., Bellazzini, M., Ferraro, F. R., & Pecci, F. F. 1997, AJ, 113, 706 [NASA ADS] [CrossRef] [Google Scholar]
- Busso, G., Cassisi, S., Piotto, G., et al. 2007, A&A, 474, 105 [NASA ADS] [CrossRef] [EDP Sciences] [Google Scholar]
- Cardelli, J. A., Clayton, G. C., & Mathis, J. S. 1989, ApJ, 345, 245 [NASA ADS] [CrossRef] [Google Scholar]
- Cassisi, S., Salaris, M., Anderson, J., et al. 2009, ApJ, 702, 1530 [NASA ADS] [CrossRef] [Google Scholar]
- Castelli, F., Gratton, R. G., & Kurucz, R. L. 1997, A&A, 318, 841 [NASA ADS] [Google Scholar]
- Catelan, M. 2009, Ap&SS, 320, 261 [NASA ADS] [CrossRef] [Google Scholar]
- Catelan, M. 2013, 40th Liège International Astrophysical Colloquium, Liège, Belgium, eds. J. Montalbán, A. Noels, & V. Van Grootel, EPJ Web of Conferences, 43, 01001 [Google Scholar]
- Catelan, M., & de Freitas Pacheco, J. A. 1995, A&A, 297, 345 [NASA ADS] [Google Scholar]
- Catelan, M., Grundahl, F., Sweigart, A. V., Valcarce, A. A. R., & Cortés, C. 2009, ApJ, 695, L97 [NASA ADS] [CrossRef] [Google Scholar]
- Coelho, P., Barbuy, B., Meléndez, J., Schiavon, R. P., & Castilho, B. V. 2005, A&A, 443, 735 [NASA ADS] [CrossRef] [EDP Sciences] [Google Scholar]
- D’Antona, F., Caloi, V., Montalbán, J., Ventura, P., & Gratton, R. 2002, A&A, 395, 69 [NASA ADS] [CrossRef] [EDP Sciences] [Google Scholar]
- D’Cruz, N. L., O’Connell, R. W., Rood, R. T., et al. 2000, ApJ, 530, 352 [NASA ADS] [CrossRef] [Google Scholar]
- Da Costa, G. S., Held, E. V., Saviane, I., & Gullieuszik, M. 2009, ApJ, 705, 1481 [NASA ADS] [CrossRef] [Google Scholar]
- Dotter, A., Sarajedini, A., Anderson, J., et al. 2010, ApJ, 708, 698 [NASA ADS] [CrossRef] [Google Scholar]
- Faulkner, J. 1966, ApJ, 144, 978 [NASA ADS] [CrossRef] [Google Scholar]
- Flower, P. J. 1996, ApJ, 469, 355 [NASA ADS] [CrossRef] [Google Scholar]
- Fraix-Burnet, D., Davoust, E., & Charbonnel, C. 2009, MNRAS, 398, 1706 [NASA ADS] [CrossRef] [Google Scholar]
- Fusi Pecci, F., Ferraro, F. R., Bellazzini, M., et al. 1993, AJ, 105, 1145 [NASA ADS] [CrossRef] [Google Scholar]
- Gratton, R. G., Carretta, E., Bragaglia, A., Lucatello, S., & D’Orazi, V. 2010, A&A, 517, A81 [NASA ADS] [CrossRef] [EDP Sciences] [Google Scholar]
- Gratton, R. G., Lucatello, S., Sollima, A., et al. 2013, A&A, 549, A41 [NASA ADS] [CrossRef] [EDP Sciences] [Google Scholar]
- Grundahl, F., Catelan, M., Landsman, W. B., Stetson, P. B., & Andersen, M. I. 1999, ApJ, 524, 242 [NASA ADS] [CrossRef] [Google Scholar]
- Hamuy, M., Walker, A. R., Suntzeff, N. B., et al. 1992, PASP, 104, 533 [NASA ADS] [CrossRef] [Google Scholar]
- Harris, W. E. 1996, AJ, 112, 1487 [NASA ADS] [CrossRef] [Google Scholar]
- Hesser, J. E., Hartwick, F. D. A., & McClure, R. D. 1977, ApJS, 33, 471 [NASA ADS] [CrossRef] [Google Scholar]
- Hoyle, F., & Schwarzschild, M. 1955, ApJS, 2, 1 [NASA ADS] [CrossRef] [Google Scholar]
- Kurucz, R. 1993, ATLAS9 Stellar Atmosphere Programs and 2 km s-1 grid. Kurucz CD-ROM No. 13, Cambridge, Mass.: Smithsonian Astrophysical Observatory, 13 [Google Scholar]
- Lee, Y., Joo, S., Han, S., et al. 2005, ApJ, 621, L57 [NASA ADS] [CrossRef] [Google Scholar]
- Marino, A. F., Milone, A. P., Piotto, G., et al. 2009, A&A, 505, 1099 [NASA ADS] [CrossRef] [EDP Sciences] [Google Scholar]
- Marino, A. F., Milone, A. P., Sneden, C., et al. 2012, A&A, 541, A15 [NASA ADS] [CrossRef] [EDP Sciences] [Google Scholar]
- Marino, A. F., Milone, A. P., & Lind, K. 2013, ApJ, 768, 27 [NASA ADS] [CrossRef] [Google Scholar]
- Michaud, G., Vauclair, G., & Vauclair, S. 1983, ApJ, 267, 256 [NASA ADS] [CrossRef] [Google Scholar]
- Michaud, G., Richer, J., & Richard, O. 2008, ApJ, 675, 1223 [NASA ADS] [CrossRef] [Google Scholar]
- Moehler, S., Sweigart, A. V., & Catelan, M. 1999, A&A, 351, 519 [NASA ADS] [Google Scholar]
- Moehler, S., Landsman, W. B., Sweigart, A. V., & Grundahl, F. 2003, A&A, 405, 135 [NASA ADS] [CrossRef] [EDP Sciences] [Google Scholar]
- Moehler, S., Dreizler, S., Lanz, T., et al. 2011, A&A, 526, A136 [NASA ADS] [CrossRef] [EDP Sciences] [Google Scholar]
- Momany, Y., Bedin, L. R., Cassisi, S., et al. 2004, A&A, 420, 605 [NASA ADS] [CrossRef] [EDP Sciences] [Google Scholar]
- Monaco, L., Pancino, E., Ferraro, F. R., & Bellazzini, M. 2004, MNRAS, 349, 1278 [NASA ADS] [CrossRef] [Google Scholar]
- Moni Bidin, C., & Piotto, G. 2010, Ap&SS, 156 [Google Scholar]
- Moni Bidin, C., Moehler, S., Piotto, G., et al. 2006, A&A, 451, 499 [NASA ADS] [CrossRef] [EDP Sciences] [Google Scholar]
- Moni Bidin, C., Moehler, S., Piotto, G., Momany, Y., & Recio-Blanco, A. 2007, A&A, 474, 505 [NASA ADS] [CrossRef] [EDP Sciences] [Google Scholar]
- Moni Bidin, C., Catelan, M., & Altmann, M. 2008, A&A, 480, L1 [NASA ADS] [CrossRef] [EDP Sciences] [Google Scholar]
- Moni Bidin, C., Moehler, S., Piotto, G., Momany, Y., & Recio-Blanco, A. 2009, A&A, 498, 737 [NASA ADS] [CrossRef] [EDP Sciences] [Google Scholar]
- Moni Bidin, C., Villanova, S., Piotto, G., Moehler, S., & D’Antona, F. 2011a, ApJ, 738, L10 [NASA ADS] [CrossRef] [Google Scholar]
- Moni Bidin, C., Villanova, S., Piotto, G., & Momany, Y. 2011b, A&A, 528, A127 [NASA ADS] [CrossRef] [EDP Sciences] [Google Scholar]
- Moni Bidin, C., Villanova, S., Piotto, G., et al. 2012, A&A, 547, A109 [NASA ADS] [CrossRef] [EDP Sciences] [Google Scholar]
- Morse, J. A., Mathieu, R. D., & Levine, S. E. 1991, AJ, 101, 1495 [NASA ADS] [CrossRef] [Google Scholar]
- Napiwotzki, R., Green, P. J., & Saffer, R. A. 1999, ApJ, 517, 399 [NASA ADS] [CrossRef] [Google Scholar]
- Norris, J. 1981, ApJ, 248, 177 [NASA ADS] [CrossRef] [Google Scholar]
- Norris, J. E. 2004, ApJ, 612, L25 [NASA ADS] [CrossRef] [Google Scholar]
- Norris, J., & Freeman, K. C. 1983, ApJ, 266, 130 [NASA ADS] [CrossRef] [Google Scholar]
- Peterson, R. C. 1983, ApJ, 275, 737 [NASA ADS] [CrossRef] [Google Scholar]
- Peterson, R. C., & Cudworth, K. M. 1994, ApJ, 420, 612 [NASA ADS] [CrossRef] [Google Scholar]
- Pietrinferni, A., Cassisi, S., Salaris, M., & Castelli, F. 2006, ApJ, 642, 797 [NASA ADS] [CrossRef] [Google Scholar]
- Piotto, G. 2009, in IAU Symp. 258, eds. E. E. Mamajek, D. R. Soderblom, & R. F. G. Wyse, 233 [Google Scholar]
- Piotto, G., & Zoccali, M. 1999, A&A, 345, 485 [NASA ADS] [Google Scholar]
- Piotto, G., Zoccali, M., King, I. R., et al. 1999, AJ, 118, 1727 [NASA ADS] [CrossRef] [Google Scholar]
- Piotto, G., Villanova, S., Bedin, L. R., et al. 2005, ApJ, 621, 777 [NASA ADS] [CrossRef] [Google Scholar]
- Quievy, D., Charbonneau, P., Michaud, G., & Richer, J. 2009, A&A, 500, 1163 [NASA ADS] [CrossRef] [EDP Sciences] [Google Scholar]
- Ramírez, I., & Meléndez, J. 2005, ApJ, 626, 465 [NASA ADS] [CrossRef] [Google Scholar]
- Recio-Blanco, A., Aparicio, A., Piotto, G., de Angeli, F., & Djorgovski, S. G. 2006, A&A, 452, 875 [NASA ADS] [CrossRef] [EDP Sciences] [Google Scholar]
- Reed, B. C., Hesser, J. E., & Shawl, S. J. 1988, PASP, 100, 545 [NASA ADS] [CrossRef] [Google Scholar]
- Richter, P., Hilker, M., & Richtler, T. 1999, A&A, 350, 476 [NASA ADS] [Google Scholar]
- Ripepi, V., Clementini, G., Di Criscienzo, M., et al. 2007, ApJ, 667, L61 [NASA ADS] [CrossRef] [Google Scholar]
- Rosenberg, A., Recio-Blanco, A., & García-Marín, M. 2004, ApJ, 603, 135 [NASA ADS] [CrossRef] [Google Scholar]
- Saffer, R. A., Bergeron, P., Koester, D., & Liebert, J. 1994, ApJ, 432, 351 [NASA ADS] [CrossRef] [Google Scholar]
- Salasnich, B., Girardi, L., Weiss, A., & Chiosi, C. 2000, A&A, 361, 1023 [NASA ADS] [Google Scholar]
- Sandage, A., & Wallerstein, G. 1960, ApJ, 131, 598 [NASA ADS] [CrossRef] [Google Scholar]
- Sandage, A., & Wildey, R. 1967, ApJ, 150, 469 [NASA ADS] [CrossRef] [Google Scholar]
- Sekiguchi, M., & Fukugita, M. 2000, AJ, 120, 1072 [NASA ADS] [CrossRef] [Google Scholar]
- Sweigart, A. V. 1997, ApJ, 474, L23 [NASA ADS] [CrossRef] [Google Scholar]
- Tonry, J., & Davis, M. 1979, AJ, 84, 1511 [NASA ADS] [CrossRef] [Google Scholar]
- van den Bergh, S. 1967, AJ, 72, 70 [NASA ADS] [CrossRef] [Google Scholar]
- Villanova, S., Piotto, G., & Gratton, R. G. 2009, A&A, 499, 755 [NASA ADS] [CrossRef] [EDP Sciences] [Google Scholar]
- Villanova, S., Geisler, D., Piotto, G., & Gratton, R. G. 2012, ApJ, 748, 62 [NASA ADS] [CrossRef] [Google Scholar]
- Webbink, R. F. 1985, in Dynamics of Star Clusters, eds. J. Goodman, & P. Hut, IAU Symp., 113, 541 [Google Scholar]
- Whitney, J. H., Rood, R. T., O’Connell, R. W., et al. 1998, ApJ, 495, 284 [NASA ADS] [CrossRef] [Google Scholar]
- Zinn, R. 1985, ApJ, 293, 424 [Google Scholar]
All Tables
All Figures
|
Fig. 1 Position of the target stars in the cluster CMD. The program stars are shown with dark filled circles, with empty circles used to indicate field objects, as discussed in the text. Grey, small dots are the cluster stars from chip #2 of Monaco et al. (2004). |
| In the text | |
|
Fig. 2 Examples of the normalized spectra of target stars at different temperatures. The spectra were vertically shifted to avoid overlap. The Balmer and helium lines and the spectral range of each star (black arrows) used in our fitting routine are indicated. |
| In the text | |
|
Fig. 3 Distribution of the measured RVs. The black areas denote the targets flagged as non-cluster members due to discrepant RV, while the grey areas indicate those whose membership is uncertain. The solid curve shows a Gaussian distribution with σ ≈ 18 km s-1 centered on RV = − 136 km s-1. |
| In the text | |
|
Fig. 4 Upper panel: position of the targets in the temperature-gravity plane. Empty and filled circles are as in Fig. 1. The canonical zero-age and terminal-age HB for canonical stars are shown with full lines, and for analogous helium-enriched (Y = 0.33) models are indicated with dashed lines. The zero-age main sequence of solar chemical composition of Salasnich et al. (2000) is shown as dotted line. Middle and lower panels: comparison of stars in M 22 (same symbols as the upper panel) and members of NGC 6752, M 80, and NGC 5986 (open, grey diamonds), and ω Cen (open, grey stars). The vertical coordinate is the difference between the stellar gravity and the corresponding value of the canonical ZAHB at the same temperature. The full and dashed curves are the same as in the upper panel. |
| In the text | |
|
Fig. 5 Spectroscopic masses of the program stars (full and empty circles as in Fig. 1) as a function of temperature, compared to the expectation of the canonical ZAHB model (line in the upper panel), and to the results for NGC 6752, M 80, and NGC 5986 (grey diamonds in the middle panel), and ω Cen (grey stars in the lower panel). |
| In the text | |
|
Fig. 6 Surface helium abundance of targets stars (empty and filled circles with error bars, as in Fig. 1), as a function of their temperature. Small, grey dots indicate the results in NGC 6752, M 80, NGC 5986, and ω Cen. The grey diamonds show the trend of helium abundance with temperature derived by MB12. The dotted line indicates the solar abundance. |
| In the text | |
|
Fig. 7 Reddening of the program stars as a function of their temperature. Empty and filled circles are used as in Fig. 1. The solid line indicates the trend of the mean value, calculated as described in the text, with its 1σ range (dotted line). |
| In the text | |
|
Fig. 8 Spatial distribution of the observed stars, where the size of each plotted point is proportional to the star’s reddening. The cross indicates the cluster’s center. |
| In the text | |
|
Fig. 9 Temperature-color relation for our target stars. Filled and empty circles are as in Fig. 1. The curve shows the best fit of the data, obtained by shifting the theoretical relation of Pietrinferni et al. (2006) and by Cassisi et al. (2009) by E(B − V) = 0.34 mag. |
| In the text | |
Current usage metrics show cumulative count of Article Views (full-text article views including HTML views, PDF and ePub downloads, according to the available data) and Abstracts Views on Vision4Press platform.
Data correspond to usage on the plateform after 2015. The current usage metrics is available 48-96 hours after online publication and is updated daily on week days.
Initial download of the metrics may take a while.