Free Access
Fig. 7
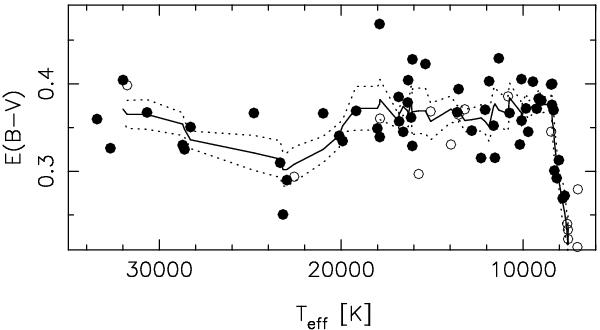
Reddening of the program stars as a function of their temperature. Empty and filled circles are used as in Fig. 1. The solid line indicates the trend of the mean value, calculated as described in the text, with its 1σ range (dotted line).
Current usage metrics show cumulative count of Article Views (full-text article views including HTML views, PDF and ePub downloads, according to the available data) and Abstracts Views on Vision4Press platform.
Data correspond to usage on the plateform after 2015. The current usage metrics is available 48-96 hours after online publication and is updated daily on week days.
Initial download of the metrics may take a while.