Free Access
Fig. 3
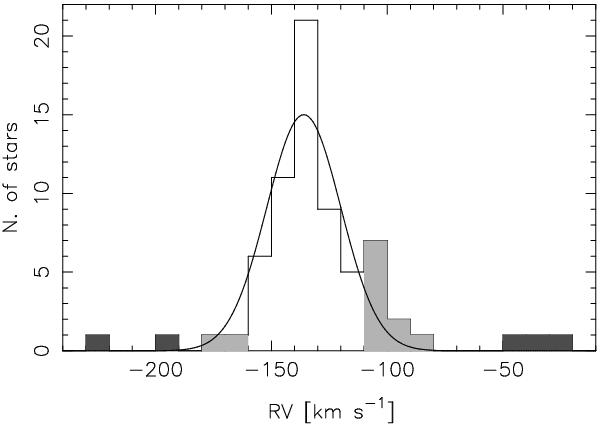
Distribution of the measured RVs. The black areas denote the targets flagged as non-cluster members due to discrepant RV, while the grey areas indicate those whose membership is uncertain. The solid curve shows a Gaussian distribution with σ ≈ 18 km s-1 centered on RV = − 136 km s-1.
Current usage metrics show cumulative count of Article Views (full-text article views including HTML views, PDF and ePub downloads, according to the available data) and Abstracts Views on Vision4Press platform.
Data correspond to usage on the plateform after 2015. The current usage metrics is available 48-96 hours after online publication and is updated daily on week days.
Initial download of the metrics may take a while.