| Issue |
A&A
Volume 559, November 2013
|
|
|---|---|---|
| Article Number | A81 | |
| Number of page(s) | 8 | |
| Section | Interstellar and circumstellar matter | |
| DOI | https://doi.org/10.1051/0004-6361/201321266 | |
| Published online | 18 November 2013 | |
Thermal and non-thermal emission in the Cygnus X region
1
College of Physical Science and Technology, Shenyang Normal
University,
110034
Shenyang,
PR China
e-mail:
This email address is being protected from spambots. You need JavaScript enabled to view it.
2
National Astronomical Observatories, Chinese Academy of Sciences,
Jia-20 Datun Road, Chaoyang
District, 100012
Beijing, PR
China
Received:
8
February
2013
Accepted:
23
September
2013
Abstract
Context. Radio continuum observations detect non-thermal synchrotron and thermal bremsstrahlung radiation. Separation of the two different emission components is crucial for studying the properties of the Galactic interstellar medium. The Cygnus X region is one of the most complex areas in the radio sky, which contains a number of massive stars and H ii regions on the diffuse thermal and non-thermal background. More supernova remnants (SNRs) are expected to be discovered.
Aims. We aim to develop a method that can properly separate the non-thermal and thermal radio continuum emission and apply it to the Cygnus X region. The result can be used to study the properties of different emission components and search for new SNRs in the complex.
Methods. Multi-frequency radio continuum data from large-scale surveys were used to develop a new component-separation method. Spectral analysis was done pixel-by-pixel for the non-thermal synchrotron emission with a realistic spectral index distribution and a fixed spectral index of β = −2.1 for the thermal bremsstrahlung emission.
Results. With the new method, we separate the non-thermal and thermal components of the Cygnus X region at an angular resolution of 95. The thermal emission component is found to comprise 75% of the total continuum radiation at λ6 cm. Thermal diffuse emission, rather than the discrete H ii regions, is found to be the major contributor to the entire thermal budget. A smooth non-thermal emission background of 100 mK Tb is found. We successfully make the large-extent known SNRs and the H ii regions embedded in the complex standing out, but no new large SNRs brighter than ∑ 1 GHz = 3.7 × 10⁻²¹ W m-2 Hz-1 sr-1 are found.
Key words: radio continuum: ISM / ISM: supernova remnants / HII regions
© ESO, 2013
1. Introduction
The Galactic radio emission at decimetre and centimetre wavelengths is composed of the non-thermal synchrotron radiation generated by the relativistic electrons spiralling in the Galactic magnetic fields and the thermal bremsstrahlung (free-free) radiation generated from the interactions between electrons and ions. Separating the non-thermal and thermal emission components in the complex areas of the Galaxy is essential to delineate the distribution of the electrons with different energy spectra and identify new radio sources buried in the confusing environments.
Basic parameters of survey data in this work
To study the properties of the interstellar medium and the foreground emission of the
cosmic microwave background, several methods have been developed to separate the Galactic
emission into non-thermal synchrotron and thermal free-free emission. Hinshaw et al. (2007) used the maximum entropy method for the component
separation of the WMAP data, where the extinction-corrected Hα template
(Finkbeiner 2003; Bennett et al. 2003) was used to derive thermal free-free emission. Using the
Effelsberg λ21 cm (Reich et al.
1990b), λ11 cm survey data (Reich
et al. 1990a), together with the Parkes λ6 cm data (Haynes et al. 1978), Paladini et al. (2005, hereafter P05) did the component separation for a thin
layer of the inner Galactic plane () by fitting the observed Galactic emission by the
thermal free-free emission with a fixed brightness temperature spectral index of
β = −2.1 (α = β + 2) and the
non-thermal synchrotron emission with a spectral index distribution of 10° resolution
derived by Giardino et al. (2002). With a similar
method, Sun et al. (2011b, hereafter S11) separated a
much larger plane area of the inner Galaxy ( )
by using the Effelsberg λ21 cm (Reich et
al. 1990b), λ11 cm (Reich et al.
1990a), and the Urumqi λ6 cm data, but with a fixed synchrotron
spectral index. Using the radio recombination line as the tracer of thermal free-fee
emission, Alves et al. (2012) separated the
non-thermal and thermal emission component for the region between
)
by using the Effelsberg λ21 cm (Reich et
al. 1990b), λ11 cm (Reich et al.
1990a), and the Urumqi λ6 cm data, but with a fixed synchrotron
spectral index. Using the radio recombination line as the tracer of thermal free-fee
emission, Alves et al. (2012) separated the
non-thermal and thermal emission component for the region between
 and
and  .
They claimed that the WMAP result greatly overestimated the thermal component in this area.
.
They claimed that the WMAP result greatly overestimated the thermal component in this area.
All these studies advanced our knowledge about the Galactic interstellar medium. However, WMAP has a coarse angular resolution of about 1°, which cannot be used for the studies of small-scale objects. The synchrotron spectral index distribution map used by P05 has an angular resolution of 10° and was derived by assuming that all the 408 MHz emission is purely non-thermal. A fixed synchrotron spectral index assumed by S11 is too simple for a practical situation in large sky areas.
With the currently available data sets, we plan to develop a new method of component
separation based on the work of P05. We aim to take a realistic synchrotron spectral index
distribution with a higher angular resolution and study the properties of the non-thermal
synchrotron and thermal free-free emission. The region we chose is the Cygnus X region,
which is located at about ℓ ~ 80° in the Galactic plane. It is one of the
most famous and complex star-forming sites in the Galaxy. It was first discovered and
presented as a very extended bright source in the early radio observations (Piddington & Minnett 1952) and later resolved
into many individual components by follow-up observations with higher angular resolutions
and sensitivities (e.g. Wendker et al. 1991; Taylor et al. 1996; Landecker et al. 2010). Although many efforts have been made to study this big
structure, the physical nature of the Cygnus X region remains unclear and is still under
debate. The controversy is whether the Cygnus X region is a structure that the Local Arm is
seen end-on (Wendker et al. 1991), or it is a huge
coherent and physically bounded structure along the line of sight (e.g. Knödlseder 2004; Schneider et al. 2006). Over two thousand massive stars are located in the Cygnus
X region (Knödlseder 2000). Therefore supernova
explosions are expected and many supernova remnants (SNRs) should exist consequently.
Observations made in the X-ray regime revealed a large bubble around the Cyg OB2
association, which might imply 30–100 supernovae explosions (Cash et al. 1980). However, to date, only 12 SNRs have been found
( ,
,
 )
according the Green SNR catalogue (Green 2009). It is
thus interesting to search for new SNRs in the Cygnus X region. The very first step is to
remove the strong confusion from the unrelated thermal emission.
)
according the Green SNR catalogue (Green 2009). It is
thus interesting to search for new SNRs in the Cygnus X region. The very first step is to
remove the strong confusion from the unrelated thermal emission.
In this paper, we develop a method for the non-thermal and thermal component separation, and search for new SNRs in the Cygnus X complex. We introduce the data sets we used in Sect. 2 and present the method and the test results in Sect. 3. We show our separation results of the Cygnus X region and make discussions in Sect. 4. A summary is given in Sect. 5.
2. Data
2.1. Data for spectral index distribution of the Galactic emission
A proper separation of the thermal and non-thermal emission requires absolutely calibrated multi-frequency radio continuum data. Observations made at very high frequencies above several tens of GHz cannot be used, since the thermal dust and the anomalous microwave emission originating in the spinning dust will contribute to the observed radio emission. Very low radio frequency observations also have to be skipped, because the thermal free-free emission will become optically thick and does not have the power law spectrum with the spectral index of β ~ −2.1. Therefore, data from the 408 MHz survey (Haslam et al. 1982), the Stockert 1420 MHz survey (Reich 1982), the Effelsberg 1408 MHz survey (Reich et al. 1990b), and the WMAP 22.8 GHz survey (Jarosik et al. 2011) were selected in our work to construct a realistic spectral index distribution for the observed Galactic emission and the synchrotron radiation at an angular resolution of 1°. The basic observational parameters of these surveys are listed in Table 1.
2.1.1. The 408 MHz survey
The 408 MHz all-sky survey was combined by the survey data from the Jodrell Bank 76-m radio telescope, the Effelsberg 100-m radio telescope, and the Parkes 64-m radio telescope (Haslam et al. 1982). The final released total intensity data has an angular resolution of 51′ and was absolutely calibrated by the 404 MHz survey data (Pauliny-Toth & Shakeshaft 1962). The uncertainty of the 408 MHz total intensity data is better than 10%.
2.1.2. The Stockert 1420 MHz survey
The Stockert 1420 MHz survey covered the northern sky by using the 25-m Stockert radio telescope (Reich 1982). The angular resolution of the survey is 354. The absolute calibration of the total intensity data was done by comparison with the horn observations (Howell & Shakeshaft 1966). The base level error and the uncertainty through the measurement of a single source are 0.5 K and 5%, respectively. By combining this survey with the 408 MHz survey, Reich & Reich (1988) derived the spectral index distribution of the observed Galactic emission of the northern sky, which is widely accepted and used.
2.1.3. The Effelberg 1408 MHz survey
The Effelsberg 1408 MHz survey is a Galactic plane survey covering the range of
−3 in the Galactic longitude direction and
in the latitude direction (Reich et al. 1990b,
1997). The angular resolution of the survey is
94. The Stockert 1420 MHz total intensity data was used to calibrate the 1408 MHz
survey. The rms of the survey is about 40 mK Tb.
in the Galactic longitude direction and
in the latitude direction (Reich et al. 1990b,
1997). The angular resolution of the survey is
94. The Stockert 1420 MHz total intensity data was used to calibrate the 1408 MHz
survey. The rms of the survey is about 40 mK Tb.
2.1.4. The WMAP K-band (22.8 GHz) survey
The K-band (22.8 GHz) WMAP data is at the lowest frequency among the five bands taken by the satellite. It contains negligible contributions of the thermal dust and the anomalous microwave emission. The angular resolution of the K-band data is 528. The seven-year released data (Jarosik et al. 2011) is used in this study. The recently released nine-year data (Bennett et al. 2013) is discussed.
2.2. Data for high angular resolution component separation
To achieve a high angular resolution component separation, observations with better resolutions are needed. The Effelsberg 1408 MHz, the Effelbserg λ11 cm, and the Urumqi λ6 cm surveys have angular resolutions of 94, 43, and 95, respectively, and therefore are used for this purpose. Absolute calibration was, however, not done for the Urumqi λ6 cm total intensity data, and only partially done for the Effelsberg λ11 cm survey in the Cygnus X region. The missing large-scale emission component must be restored prior to the component separation (see details in Sect. 3).
2.2.1. The Urumqi λ6 cm survey
The Urumqi λ6 cm data of the Cygnus X region was extracted from a
section of the Sino-German λ6 cm polarization survey of the Galactic
plane (Xiao et al. 2011)1. The observations were conducted by the Urumqi 25-m radio
telescope. The survey covers the Galactic plane from 10° to 230° in the Galactic
longitude and  in the latitude, with an angular resolution of 95. The uncertainty measured from a
structureless area in the Cygnus X region was about 4 mK Tb.
in the latitude, with an angular resolution of 95. The uncertainty measured from a
structureless area in the Cygnus X region was about 4 mK Tb.
2.2.2. The Effelsberg λ11 cm survey
The Effelsbserg λ11 cm survey was conducted by the Effelsberg 100-m
radio telescope (Fürst et al. 1990; Reich et al. 1990a). This survey has an angular
resolution of 43. The missing large-scale component was added by comparing with the
Stockert λ11 cm survey data (Reif et
al. 1987), but only for the area of  ,
.
The rms of the survey data was about 25 mK Tb.
,
.
The rms of the survey data was about 25 mK Tb.
3. Method and test
3.1. Method
Our method for the component separation is based on the work of P05. The observed radio
brightness temperature at a frequency ν consists of several contributions
(Reich & Reich 1988):
 (1)where
Tgal(ν) is the Galactic emission, composed
of the thermal free-free and the non-thermal synchrotron emission,
Tcmb is the 2.73 K contribution of the cosmic background,
Tex represents the component of the unresolved extragalactic
sources, and Tzero is the zero level of the data set to be
corrected. The last three contributions comprise Toff
[=Tcmb + Tex(ν) + Tzero(ν)],
which should be subtracted first before the component separation. We got the values of
Toff for each survey from the literature and present them in
Table 1.
(1)where
Tgal(ν) is the Galactic emission, composed
of the thermal free-free and the non-thermal synchrotron emission,
Tcmb is the 2.73 K contribution of the cosmic background,
Tex represents the component of the unresolved extragalactic
sources, and Tzero is the zero level of the data set to be
corrected. The last three contributions comprise Toff
[=Tcmb + Tex(ν) + Tzero(ν)],
which should be subtracted first before the component separation. We got the values of
Toff for each survey from the literature and present them in
Table 1.
After the Toff correction, we have the brightness temperature
of the observed Galactic emission as
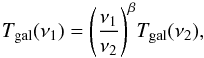
 (2)where,
Tth(ν) and
Tsyn(ν) are the thermal free-free and the
non-thermal synchrotron radiation observed at a frequency ν. Both of the
emission contributions have power law spectra but with different spectral indices. For
observations at two different frequencies, we have
(2)where,
Tth(ν) and
Tsyn(ν) are the thermal free-free and the
non-thermal synchrotron radiation observed at a frequency ν. Both of the
emission contributions have power law spectra but with different spectral indices. For
observations at two different frequencies, we have 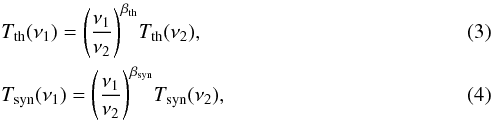 where
βth is the brightness temperature spectral index of the
thermal free-free emission, while βsyn is for the non-thermal
synchrotron emission. As noted by P05, two power laws added together do not make another
power law. However, we can always find a directly derived spectral index
“β” for the observed brightness temperatures at two bands:
where
βth is the brightness temperature spectral index of the
thermal free-free emission, while βsyn is for the non-thermal
synchrotron emission. As noted by P05, two power laws added together do not make another
power law. However, we can always find a directly derived spectral index
“β” for the observed brightness temperatures at two bands:
 (5)We show the changes in
β for wavelength pairs as a function of thermal emission fraction in
Fig. 1. We emphasize here that β
varies with different frequency pairs and with thermal (non-thermal) fractions.
(5)We show the changes in
β for wavelength pairs as a function of thermal emission fraction in
Fig. 1. We emphasize here that β
varies with different frequency pairs and with thermal (non-thermal) fractions.
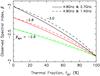 |
Fig. 1 Thermal fraction at λ6 cm versus the spectral index β of observed Galactic emission. The spectral index of thermal free-free emission is fixed to be −2.1, while the spectral index of non-thermal synchrotron emission is assumed to be −3.0 (black lines), −2.8 (red lines), and −2.6 (green lines). The curves calculated between λ6 cm and λ11 cm are shown by a solid line and λ6 cm and λ21 cm by a dashed line. |
Combining Eqs. (3) to (5), as done by P05, we easily derived the thermal fraction at
frequency ν1 as
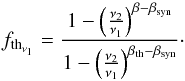 (6)This equation is the key
to all of the following derivations.
(6)This equation is the key
to all of the following derivations.
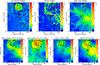 |
Fig. 2 Maps for the test region. Upper panels: high-resolution (95) images of decomposed non-thermal (panel a)) and thermal (panel b)) emission at λ6 cm overlaid by contours of the λ6 cm total intensity (not decomposed). The contour lines run in 50, 65, 80, 105, and 120 mK Tb. The SNR HB9 is labelled with name, while the known H ii regions are labelled with diamonds and names. Panel c): the IRIS 60 μm image overlaid by the same contours as in panels a) and b). Images in the lower panels are convolved to an angular resolution of 1°, and overlaid by the same contours as in the upper panels. Decomposed thermal emission component by using our method (panel d)) is compared with that by the method of Sun et al. (2011b) (panel e)) and also those from the WMAP seven-year and nine-year free-free templates (panels f) and g)). |
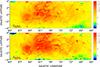 |
Fig. 3 Spectral index maps of the Galactic emission derived from survey maps at λ6 cm and λ21 cm bands (upper panel) and at λ6 cm and λ11 cm bands (lower panel). |
We explain our algorithm for the component separation in below. We first subtracted
Toff in the 408 MHz, Stockert 1420 MHz, Effelsberg 1408 MHz
maps, and the dust template2 from the WMAP
K-band map. Then they are convolved to a common angular resolution of
1°. According to Eq. (6), the 408 MHz and the Stockert 1420 MHz data can be used to
calculate the thermal fraction at 1420 MHz, while the Effelsberg 1408 MHz and the WMAP
22 800 MHz data can be used for deriving the thermal fraction at 1408 MHz. The two
fraction values should be the same at nearly the same frequency. The spectral index of the
observed Galactic emission were calculated pixel-by-pixel as
 and
and  according to Eq. (5). The thermal brightness temperature spectral index is set to a fixed
value of βth = −2.1. The only unknown non-thermal
synchrotron emission spectral index βsyn in Eq. (6) is fitted
in the range of −2.1 to −3.0. If the thermal fractions
(fth1.4 GHz) calculated from the 408/1420 data
pair and the 1408/22 800 data pair have a difference less than 5%, the fitted
βsyn is recorded. This group of
βsyn is finally averaged and taken as the final solution for
the pixel. If no βsyn fits for a pixel, we set the thermal
fraction fth1.4 GHz as the average value of the
surrounding pixels and then calculate βsyn. If both
β408−1420 and β1408−22 800
are greater than −2.1, most of the emission comes from the thermal emission. The
non-thermal emission of the pixel is taken from the nearest pixels where the calculation
is possible. After this procedure, we got the map of thermal fraction, and the brightness
temperature map of the thermal emission at 1.4 GHz at an angular resolution of 1°.
Non-thermal emission map is then calculated by subtracting the thermal emission map from
the 1408 MHz total intensity map. With the spectral index
βth = −2.1, and the βsyn pixel
by pixel, the thermal and non-thermal emission components can be separated from
observations at any frequency.
according to Eq. (5). The thermal brightness temperature spectral index is set to a fixed
value of βth = −2.1. The only unknown non-thermal
synchrotron emission spectral index βsyn in Eq. (6) is fitted
in the range of −2.1 to −3.0. If the thermal fractions
(fth1.4 GHz) calculated from the 408/1420 data
pair and the 1408/22 800 data pair have a difference less than 5%, the fitted
βsyn is recorded. This group of
βsyn is finally averaged and taken as the final solution for
the pixel. If no βsyn fits for a pixel, we set the thermal
fraction fth1.4 GHz as the average value of the
surrounding pixels and then calculate βsyn. If both
β408−1420 and β1408−22 800
are greater than −2.1, most of the emission comes from the thermal emission. The
non-thermal emission of the pixel is taken from the nearest pixels where the calculation
is possible. After this procedure, we got the map of thermal fraction, and the brightness
temperature map of the thermal emission at 1.4 GHz at an angular resolution of 1°.
Non-thermal emission map is then calculated by subtracting the thermal emission map from
the 1408 MHz total intensity map. With the spectral index
βth = −2.1, and the βsyn pixel
by pixel, the thermal and non-thermal emission components can be separated from
observations at any frequency.
The separated components obtained above have an angular resolution of 1°. By taking the data from the Urumqi λ6 cm, Effelsberg λ11 cm, and the Effelsberg λ21 cm (1408 MHz) surveys, a decomposition at an angular resolution of 95 can be made. However, as described in Sect. 2, both the λ6 cm and λ11 cm total intensity data miss the large-scale emission component. Tzero must be corrected prior to the separation. S11 developed a method for the base-level restoration for the Urumqi survey towards the inner Galactic plane area. Their method requires structureless edges of the map in the latitude direction. It is not applicable to the Cygnus X region, since the complex is too extended, exceeding 4° in b. We therefore restored the missing large-scale component for the λ6 cm data according to the method introduced by Reich et al. (1990b). We first extrapolated the 1° angular resolution Effelsberg 1408 MHz thermal and non-thermal emission component to λ6 cm by using βth and βsyn, pixel by pixel. The sum of the two extrapolated components was set as a fully calibrated template that contains the emission from all scales. Then we convolved the originally observed λ6 cm data to the same angular resolution of 1° and compared this with the template. The difference was calculated and added back to the observed λ6 cm data as the missing large-scale component. The same procedure was done for the Effelsberg λ11 cm data. Then the Effelberg λ11 cm and λ21 cm data were convolved to the angular resolution of 95, the same as the Urumqi λ6 cm data. Following the algorithm we introduced above, component separation with a higher angular resolution can be realized at the wavelength of λ6 cm.
3.2. Results for a test region
To verify the capability of our new method, a region of
 ,
,
involving the well-known SNR HB9, some H ii regions, and diffuse emission, was
firstly tested qualitatively. We show the decomposition results in the upper panel of Fig.
2. The maps show reasonable results for many
sources. The SNR HB9 and many extragalactic sources: four extragalactic sources located
around in the west of HB9, the sources at , , , and all clearly show up in the separated
non-thermal component image (Fig. 2, panel a) as
expected. Free-free emission of the large H ii region SH 2-216 (16 in diameter
Tweedy et al. 1995) and the H ii region
G160.3+0.9 (Blitz et al. 1982; Kuchar & Clark 1997) are successfully separated into the
thermal component map (Fig. 2, panel b). Thermal
emission associated with the H ii region SH 2-214 () is not seen, since no clear
radio counterpart of this object was detected at λ6 cm.
,
,
involving the well-known SNR HB9, some H ii regions, and diffuse emission, was
firstly tested qualitatively. We show the decomposition results in the upper panel of Fig.
2. The maps show reasonable results for many
sources. The SNR HB9 and many extragalactic sources: four extragalactic sources located
around in the west of HB9, the sources at , , , and all clearly show up in the separated
non-thermal component image (Fig. 2, panel a) as
expected. Free-free emission of the large H ii region SH 2-216 (16 in diameter
Tweedy et al. 1995) and the H ii region
G160.3+0.9 (Blitz et al. 1982; Kuchar & Clark 1997) are successfully separated into the
thermal component map (Fig. 2, panel b). Thermal
emission associated with the H ii region SH 2-214 () is not seen, since no clear
radio counterpart of this object was detected at λ6 cm.
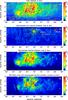 |
Fig. 4 The λ6 cm radio maps of total intensity (panel a)), decomposed non-thermal (panel b)), and thermal (panel c)) emission in the Cygnus X region at an angular resolution of 95. The IRIS 60 μm image (panel d)) of the Cygnus X region is shown for comparison with the decomposed thermal map. Contours in panels a) and c) are running in steps of 70 + 2n−1 × 30 mK Tb (n = 0, 1, 2...). The contours in panel b) for non-thermal emission run in 100, 150, 200, 300, 500, and 800 mK Tb. Contours in panel d) are the same as those in panel c). The visible SNRs are indicated in panel b). |
We further cross-checked the output of the new method with that of the S11 method and with those from the free-free emission template of the seven-year (Gold et al. 2011) and nine-year WMAP data (Bennett et al. 2013) extrapolated from λ1.3 cm to λ6 cm with the brightness temperature spectral index of β = −2.1, at the same angular resolution of 1°. It is important and necessary to do these comparisons, since our method and that of S11 both rely on the radio continuum data and the determination of the non-thermal spectral indices, while the WMAP template is independent, using the Hα data to estimate the contribution from the thermal free-free emission. The comparison is shown in the lower panels of Fig. 2, and we found that our result is better. Generally, the thermal emission component map produced by our new method shows similar structures to those shown in the WMAP templates. However, the images from the WMAP templates and the S11 method unexpectedly show a large amount of thermal emission within the SNR HB9, which is supposed to be a purely non-thermal source. S11 explained this leakage as the result from a fixed non-thermal synchrotron spectral index. For the large thermal H ii region SH 2-216, we found structural resemblance between radio emission and the IRIS 60 μm infrared dust emission (Miville-Deschênes & Lagache 2005), which confirms the thermal property of the large area. The thermal emission of SH 2-216 is separated out well by our method, as also shown in the two WMAP templates, but very little thermal emission can be separated out by the S11 method. We noticed that the thermal emission of SH 2-216 figured out by our method is less than that derived by the WMAP nine-year data, but more than that by using the WMAP seven-year data. We do not understand the big difference between the two templates.
Another indication of a validation of the new method comes from an identical structure to the southeast of the SNR HB9. Radio emission in this region can be separated out in the thermal component map and seen in the images shown in Fig. 2 by all four methods. Strong infrared emission in this region is detected in the IRIS 60 μm image, implying its thermal nature.
“Leakage”, however, is seen in a few sources, perhaps due to the fluctuations in the data pixels from the observations. For example, the thermal H ii region SH 2-217 () is partially seen in the non-thermal emission image.
4. Application of the new method to the Cygnus X region
After proving the applicability of the new method, we applied it to decomposing the thermal and non-thermal emission components in the Cygnus X region. As noticed above the WMAP seven-year and nine-year data show discrepancies in the test region. We used the two versions of the WMAP data in our calculation alternatively. The seven-year data give more reasonable results and were finally used. We show in Fig. 3 the spectral index β maps of the observed Galactic emission in the Cygnus X region derived between the Urumqi λ6 cm and Effelsberg λ21 cm (1408 MHz) data, and between the Urumqi λ6 cm and Effelsberg λ11 cm data, and present in Fig. 4 the separation result of the thermal and non-thermal components. The spectral index map derived between λ6 cm and λ21 cm is much smoother than the one from λ6 cm and λ11 cm. We suspect that it is partially due to the small frequency separation and partially due to the scanning effect in the λ11 cm survey, shown as horizontal stripes around ℓ ~ 81° in the separation results as shown in Fig. 3. The first glance of the overall structure decomposed by the new method confirms the conclusions of Wendker et al. (1991) that nearly all the prominent radio radiation from the Cygnus X region comes from the thermal free-free emission. Many elongated thermal ridges are identical to what they have discovered. All known H ii regions listed by Sharpless (1959) and Paladini et al. (2003) are found to have thermal emission in the separated image, which can be verified by the infrared image (see Fig. 4, panel d).
4.1. Diffuse emission
Non-thermal radiation in the Cygnus X region is weak and diffuse (see Fig. 4, panel b). No significant enhancement in synchrotron radiation across the longitude range of 66° to 90° is noticed. This does not conflict with the point of view that the Cygnus X region is a complex that the local arm is seen end-on (Wendker et al. 1991). Either because the local arm has a certain width and our angle of view might not exceed this scale and/or the local arm is relatively fainter than the major arms, the non-thermal radiation we see in this region is predominately contributed by the farther Perseus arm. The rms of the non-thermal component image is about 20 mK Tb at λ6 cm. Although the image appears to be mottled, which we believe was introduced by the uncertainties in the data, the intensity on large scales is uniform in general, around 100 mK Tb at λ6 cm. This quantity, shown as the gap between the total power and thermal emission profiles in Fig. 5 is always standing there even by three different methods. With the non-thermal emission components separated by the λ21 cm, λ11 cm, and λ6 cm data, discarding the regions of the known SNRs, we estimate the average synchrotron spectral index of the Cygnus X region as being βsyn = −2.8 ± 0.1.
The distribution of thermal radiation concentrates in two areas (see Fig. 4, panel c). One is the main part of the Cygnus X region, in the centre of the map, about 9° span in the Galactic longitude direction. The majority of known H ii regions can be found in this region. The other area with enhanced thermal emission is W80 (), whose optical counterpart contains the well-known North America Nebula and the Pelican Nebula. The thermal emission in both of the areas account for ~75% of the total intensity of the λ6 cm continuum radiation.
For the large-scale thermal emission, we statistically compared the one-dimensional averaged results derived by our method, the S11 method, and the WMAP template at λ6 cm at an angular resolution of 1°. The intensity of each pixel is averaged in the longitude direction and the profiles are shown in Fig. 5. The three profiles highly resemble each other and the decomposition failures in the individual sources (like the case of SNR HB9) do not affect the statistics on very large scales, as noted by S11.
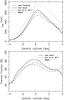 |
Fig. 5 Galactic latitude profiles for the averaged intensities (upper
panel) and averaged thermal fractions (lower panel) at
λ6 cm in the Cygnus X region
( |
4.2. Uncertainty of results
A qualitative comparison in Fig. 2 shows that the new separation method performances better in the details than the other methods. In a statistical sense, the new method gives consistent results with those by the WMAP template and the S11 method (see Fig. 5). Here we estimate the uncertainties of the separation result of the Cygnus X region. From the errors of the low-resolution surveys, an uncertainty of 5% was estimated for the λ6 cm and λ11 cm data after restoration of the missing large-scale emission. Based on the standard error propagation, the uncertainty of the separated thermal and non-thermal components derived by the new method with the Effelsberg λ21 cm, λ11 cm, and the Urumqi λ6 cm data as shown in Fig. 4 is about 17%. As noted by Wendker et al. (1991), the accuracy in the low emission area, usually the data points away from the Galactic plane near edges of the image, tends to be worse than for the area of strong emission with high signal-to-noise ratio. We tested the pixels near the boundary of the separated map and found the uncertainties are indeed higher, but at most 30%.
4.3. Notes on discrete sources
According to Paladini et al. (2003), 145 individually known H ii regions are located in the Cygnus X region. We summed their flux density according to the Paladini catalogue and extrapolated it to λ6 cm band by the spectral index of β = −2.1. We found that the individual H ii regions only account for 4% of the total thermal emission at λ6 cm. Although this might be the lower limit, since H ii regions are difficult to identify in such a complex area, diffuse thermal emission undoubtdely dominates the whole thermal emission budget.
There are 12 known SNRs in the catalogue of Green
(2009) in the region ranging of ,
 .
Two large SNRs, G78.2+2.1 (DR4) and G69.0+2.7 (CTB 80), have already been studied in Gao et al. (2011) with the Urumqi λ6 cm
survey data, while five small SNRs G73.9+0.9, G74.9+1.2, G76.9+1.0, G84.2−0.8, and
G85.9−0.6, were investigated in Sun et al. (2011a).
From the non-thermal emission component shown in Fig. 4, both SNR G78.2+2.1 and CTB 80 are clearly separated out by the new method. In
the original map, the SNR G78.2+2.1 is heavily confused by the strong thermal emission and
the surrounding structures. Gao et al. (2011) used
the “background filtering” technique (Sofue &
Reich 1979) and subtracted a fitted twisted hyperplane to eliminate the unrelated
non-thermal background and the ambient thermal emission (see Fig. 1 of Gao et al. 2011). The image of Fig. 4b from the new method shows less contamination of thermal emission by
successfully getting rid of the confusion from the H ii region G78.3+2.8 in the
north, IC 1318b in the south and southeast, and perhaps also the contribution of the
unrelated small H ii region, γ Cygni nebula, which coincides in
the southern shell of the SNR G78.2+2.1. The λ6 cm integrated flux
density for this SNR is now found to be ~140 Jy, consistent with the result found by Gao et al. (2011). Faint non-thermal radiation is seen
in the south, north-west, and north-east of the SNR G78.2+2.1. We suppose that these might
result from the “leakages”.
.
Two large SNRs, G78.2+2.1 (DR4) and G69.0+2.7 (CTB 80), have already been studied in Gao et al. (2011) with the Urumqi λ6 cm
survey data, while five small SNRs G73.9+0.9, G74.9+1.2, G76.9+1.0, G84.2−0.8, and
G85.9−0.6, were investigated in Sun et al. (2011a).
From the non-thermal emission component shown in Fig. 4, both SNR G78.2+2.1 and CTB 80 are clearly separated out by the new method. In
the original map, the SNR G78.2+2.1 is heavily confused by the strong thermal emission and
the surrounding structures. Gao et al. (2011) used
the “background filtering” technique (Sofue &
Reich 1979) and subtracted a fitted twisted hyperplane to eliminate the unrelated
non-thermal background and the ambient thermal emission (see Fig. 1 of Gao et al. 2011). The image of Fig. 4b from the new method shows less contamination of thermal emission by
successfully getting rid of the confusion from the H ii region G78.3+2.8 in the
north, IC 1318b in the south and southeast, and perhaps also the contribution of the
unrelated small H ii region, γ Cygni nebula, which coincides in
the southern shell of the SNR G78.2+2.1. The λ6 cm integrated flux
density for this SNR is now found to be ~140 Jy, consistent with the result found by Gao et al. (2011). Faint non-thermal radiation is seen
in the south, north-west, and north-east of the SNR G78.2+2.1. We suppose that these might
result from the “leakages”.
Besides the two large SNRs, we can see the SNRs G73.9+0.9, G74.9+1.2, G84.2−0.8, and G85.9−0.6 from the separated map. The last two are much fainter than their measured intensity (Sun et al. 2011a). This is not the “leakage” problem, but comes from the data we used. The spectral indices β of the two SNRs derived between λ6 cm and λ11 cm are both around ~−2.2, too flat for shell-type SNRs. We cannot separate out the SNR G76.9+1.0, since no solutions can be matched between the data pair of 1408 MHz/4800 MHz and 2700 MHz/4800 MHz. The remaining five SNRs G67.7+1.8, G68.6−1.2, G69.7+1.0, G85.4+0.7, and G83.0−0.3 were not included in any previous Urumqi λ6 cm studies. All of them are faint and less than 30′ in diameter, structureless when seen with our 9.5′ beam. The first three were deeply embedded in the radio complex of W80. We do see some signatures of these objects in the decomposed non-thermal emission image, but they are fragmented. “Leakages” to the thermal emission with various amounts are detected for all of them, thus no good measurement can be made.
Apart from the known SNRs, we carefully checked the spectral index distributions of the observed Galactic emission and the suspicious structures in the non-thermal emission images for possible new SNRs, but failed to find any new features. We estimate the surface brightness limit of a shell-type SNR that can be identified in the decomposed non-thermal emission map by using the equation Σ1 GHz = 1.505 × 10⁻¹⁹S1 GHz/θ2, where S1GHz is obtained by extrapolating S6 cm = 1 Jy (160 mK), the 3σ level above the non-thermal background emission (100 mK) to 1 GHz, using the typical spectral index of α = −0.5 for shell-type SNRs; θ is the beam size of 95, the smallest scale of sources that can be seen in the data. We finally conclude that no new large-extent SNRs brighter than Σ1GHz = 3.7 × 10⁻²¹ W m-2 Hz-1 sr-1 can be found in our separated non-thermal image of the Cygnus X region.
5. Summary
We developed a new method that can be used to separate the thermal free-free and the non-thermal synchrotron emission components by using the radio continuum survey data. The new method was applied to the Cygnus X complex region. We found that the thermal free-free emission comprises 75% of the total continuum radiation in the Cygnus X region at λ6 cm. We compared the large-scale thermal structures decomposed by the new method with that derived from the WMAP data, and found that they are consistent with each other. A uniform non-thermal background in the Cygnus X region is found to be 100 ± 20 mK at λ6 cm. The separation by using the Effelsberg λ21 cm, λ11 cm, and the Urumqi λ6 cm maps enabled us to search for new large and faint SNRs in the Cygnus X region at an angular resolution of 95. However, no new large-extent SNRs brighter than ∑ 1 GHz = 3.7 × 10⁻²¹ W m-2 Hz-1 sr-1 have been discovered.
Acknowledgments
The authors would like to thank the anonymous referee for constructive suggestions, and Dr. Wolfgang Reich and Dr. Xiaohui Sun for helpful discussions. X.W.F. would like to thank Mr. Tao Hong for helping with the production of plots and carefully reading the manuscript. The authors are supported by the National Natural Science foundation of China (10773016, 11303035, 11103013, and 11261140641) and X.Y.G. is additionally supported by the Young Researcher Grant of National Astronomical Observatories, Chinese Academy of Sciences.
References
- Alves, M. I. R., Davies, R. D., Dickinson, C., et al. 2012, MNRAS, 422, 2429 [NASA ADS] [CrossRef] [Google Scholar]
- Bennett, C. L., Halpern, M., Hinshaw, G., et al. 2003, ApJS, 148, 1 [NASA ADS] [CrossRef] [Google Scholar]
- Bennett, C. L., Larson, D., Weiland, J. L., et al. 2013, ApJS, 208, 20 [Google Scholar]
- Blitz, L., Fich, M., & Stark, A. A. 1982, ApJS, 49, 183 [NASA ADS] [CrossRef] [Google Scholar]
- Cash, W., Charles, P., Bowyer, S., et al. 1980, ApJ, 238, L71 [NASA ADS] [CrossRef] [Google Scholar]
- Finkbeiner, D. P. 2003, ApJS, 146, 407 [NASA ADS] [CrossRef] [Google Scholar]
- Fürst, E., Reich, W., Reich, P., & Reif, K. 1990, A&AS, 85, 691 [NASA ADS] [Google Scholar]
- Gao, X. Y., Han, J. L., Reich, W., et al. 2011, A&A, 529, A159 [NASA ADS] [CrossRef] [EDP Sciences] [Google Scholar]
- Giardino, G., Banday, A. J., Górski, K. M., et al. 2002, A&A, 387, 82 [NASA ADS] [CrossRef] [EDP Sciences] [Google Scholar]
- Gold, B., Odegard, N., Weiland, J. L., et al. 2011, ApJS, 192, 15 [Google Scholar]
- Green, D. A. 2009, Bull. Astron. Soc. India, 37, 45 [Google Scholar]
- Haslam, C. G. T., Salter, C. J., Stoffel, H., & Wilson, W. E. 1982, A&AS, 47, 1 [NASA ADS] [Google Scholar]
- Haynes, R. F., Caswell, J. L., & Simons, L. W. J. 1978, Aust. J. Phys. Astrophys. Suppl., 45, 1 [NASA ADS] [Google Scholar]
- Hinshaw, G., Nolta, M. R., Bennett, C. L., et al. 2007, ApJS, 170, 288 [NASA ADS] [CrossRef] [Google Scholar]
- Howell, T. F., & Shakeshaft, J. R. 1966, Nature, 210, 1318 [NASA ADS] [CrossRef] [Google Scholar]
- Jarosik, N., Bennett, C. L., Dunkley, J., et al. 2011, ApJS, 192, 14 [NASA ADS] [CrossRef] [Google Scholar]
- Knödlseder, J. 2000, A&A, 360, 539 [NASA ADS] [Google Scholar]
- Knödlseder, J. 2004 [arXiv:astro-ph/0407050] [Google Scholar]
- Kuchar, T. A., & Clark, F. O. 1997, ApJ, 488, 224 [NASA ADS] [CrossRef] [Google Scholar]
- Landecker, T. L., Reich, W., Reid, R. I., et al. 2010, A&A, 520, A80 [NASA ADS] [CrossRef] [EDP Sciences] [Google Scholar]
- Miville-Deschênes, M., & Lagache, G. 2005, ApJS, 157, 302 [NASA ADS] [CrossRef] [Google Scholar]
- Paladini, R., Burigana, C., Davies, R. D., et al. 2003, A&A, 397, 213 [NASA ADS] [CrossRef] [EDP Sciences] [Google Scholar]
- Paladini, R., De Zotti, G., Davies, R. D., & Giard, M. 2005, MNRAS, 360, 1545 (P05) [NASA ADS] [CrossRef] [Google Scholar]
- Pauliny-Toth, I. K., & Shakeshaft, J. R. 1962, MNRAS, 124, 61 [NASA ADS] [Google Scholar]
- Piddington, J. H., & Minnett, H. C. 1952, Aust. J. Sci. Res. A Phys. Sci., 5, 17 [NASA ADS] [Google Scholar]
- Reich, P., & Reich, W. 1988, A&AS, 74, 7 [NASA ADS] [Google Scholar]
- Reich, P., Reich, W., & Fürst, E. 1997, A&AS, 126, 413 [NASA ADS] [CrossRef] [EDP Sciences] [Google Scholar]
- Reich, P., Reich, W., & Testori, J. C. 2004, in The Magnetized Interstellar Medium, eds. B. Uyaniker, W. Reich, & R. Wielebinski, 63 [Google Scholar]
- Reich, W. 1982, A&AS, 48, 219 [NASA ADS] [Google Scholar]
- Reich, W., Fürst, E., Reich, P., & Reif, K. 1990a, A&AS, 85, 633 [NASA ADS] [Google Scholar]
- Reich, W., Reich, P., & Fürst, E. 1990b, A&AS, 83, 539 [NASA ADS] [Google Scholar]
- Reif, K., Reich, W., Steffen, P., Müller, P., & Weiland, H. 1987, Mitteilungen der Astronomischen Gesellschaft Hamburg, 70, 419 [NASA ADS] [Google Scholar]
- Schneider, N., Bontemps, S., Simon, R., et al. 2006, A&A, 458, 855 [NASA ADS] [CrossRef] [EDP Sciences] [Google Scholar]
- Sharpless, S. 1959, ApJS, 4, 257 [Google Scholar]
- Sofue, Y., & Reich, W. 1979, A&AS, 38, 251 [NASA ADS] [Google Scholar]
- Sun, X. H., Reich, P., Reich, W., et al. 2011a, A&A, 536, A83 [NASA ADS] [CrossRef] [EDP Sciences] [Google Scholar]
- Sun, X. H., Reich, W., Han, J. L., et al. 2011b, A&A, 527, A74 (S11) [NASA ADS] [CrossRef] [EDP Sciences] [Google Scholar]
- Taylor, A. R., Goss, W. M., Coleman, P. H., van Leeuwen, J., & Wallace, B. J. 1996, ApJS, 107, 239 [NASA ADS] [CrossRef] [Google Scholar]
- Tweedy, R. W., Martos, M. A., & Noriega-Crespo, A. 1995, ApJ, 447, 257 [NASA ADS] [CrossRef] [Google Scholar]
- Wendker, H. J., Higgs, L. A., & Landecker, T. L. 1991, A&A, 241, 551 [NASA ADS] [Google Scholar]
- Xiao, L., Han, J. L., Reich, W., et al. 2011, A&A, 529, A15 [NASA ADS] [CrossRef] [EDP Sciences] [Google Scholar]
All Tables
All Figures
|
Fig. 1 Thermal fraction at λ6 cm versus the spectral index β of observed Galactic emission. The spectral index of thermal free-free emission is fixed to be −2.1, while the spectral index of non-thermal synchrotron emission is assumed to be −3.0 (black lines), −2.8 (red lines), and −2.6 (green lines). The curves calculated between λ6 cm and λ11 cm are shown by a solid line and λ6 cm and λ21 cm by a dashed line. |
| In the text | |
|
Fig. 2 Maps for the test region. Upper panels: high-resolution (95) images of decomposed non-thermal (panel a)) and thermal (panel b)) emission at λ6 cm overlaid by contours of the λ6 cm total intensity (not decomposed). The contour lines run in 50, 65, 80, 105, and 120 mK Tb. The SNR HB9 is labelled with name, while the known H ii regions are labelled with diamonds and names. Panel c): the IRIS 60 μm image overlaid by the same contours as in panels a) and b). Images in the lower panels are convolved to an angular resolution of 1°, and overlaid by the same contours as in the upper panels. Decomposed thermal emission component by using our method (panel d)) is compared with that by the method of Sun et al. (2011b) (panel e)) and also those from the WMAP seven-year and nine-year free-free templates (panels f) and g)). |
| In the text | |
|
Fig. 3 Spectral index maps of the Galactic emission derived from survey maps at λ6 cm and λ21 cm bands (upper panel) and at λ6 cm and λ11 cm bands (lower panel). |
| In the text | |
|
Fig. 4 The λ6 cm radio maps of total intensity (panel a)), decomposed non-thermal (panel b)), and thermal (panel c)) emission in the Cygnus X region at an angular resolution of 95. The IRIS 60 μm image (panel d)) of the Cygnus X region is shown for comparison with the decomposed thermal map. Contours in panels a) and c) are running in steps of 70 + 2n−1 × 30 mK Tb (n = 0, 1, 2...). The contours in panel b) for non-thermal emission run in 100, 150, 200, 300, 500, and 800 mK Tb. Contours in panel d) are the same as those in panel c). The visible SNRs are indicated in panel b). |
| In the text | |
|
Fig. 5 Galactic latitude profiles for the averaged intensities (upper
panel) and averaged thermal fractions (lower panel) at
λ6 cm in the Cygnus X region
( |
| In the text | |
Current usage metrics show cumulative count of Article Views (full-text article views including HTML views, PDF and ePub downloads, according to the available data) and Abstracts Views on Vision4Press platform.
Data correspond to usage on the plateform after 2015. The current usage metrics is available 48-96 hours after online publication and is updated daily on week days.
Initial download of the metrics may take a while.