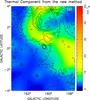
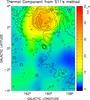
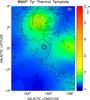
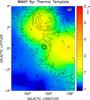
Fig. 2
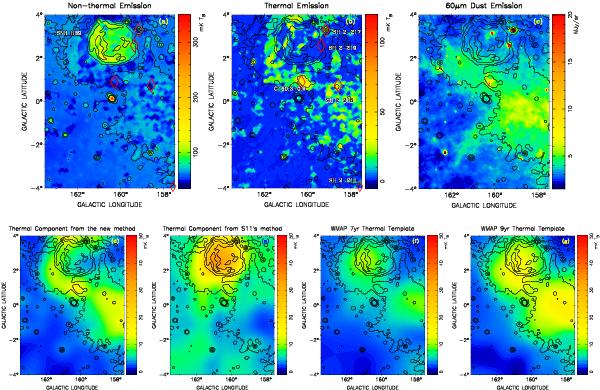
Maps for the test region. Upper panels: high-resolution (95) images of decomposed non-thermal (panel a)) and thermal (panel b)) emission at λ6 cm overlaid by contours of the λ6 cm total intensity (not decomposed). The contour lines run in 50, 65, 80, 105, and 120 mK Tb. The SNR HB9 is labelled with name, while the known H ii regions are labelled with diamonds and names. Panel c): the IRIS 60 μm image overlaid by the same contours as in panels a) and b). Images in the lower panels are convolved to an angular resolution of 1°, and overlaid by the same contours as in the upper panels. Decomposed thermal emission component by using our method (panel d)) is compared with that by the method of Sun et al. (2011b) (panel e)) and also those from the WMAP seven-year and nine-year free-free templates (panels f) and g)).
Current usage metrics show cumulative count of Article Views (full-text article views including HTML views, PDF and ePub downloads, according to the available data) and Abstracts Views on Vision4Press platform.
Data correspond to usage on the plateform after 2015. The current usage metrics is available 48-96 hours after online publication and is updated daily on week days.
Initial download of the metrics may take a while.