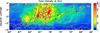
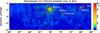
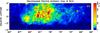
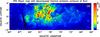
Fig. 4
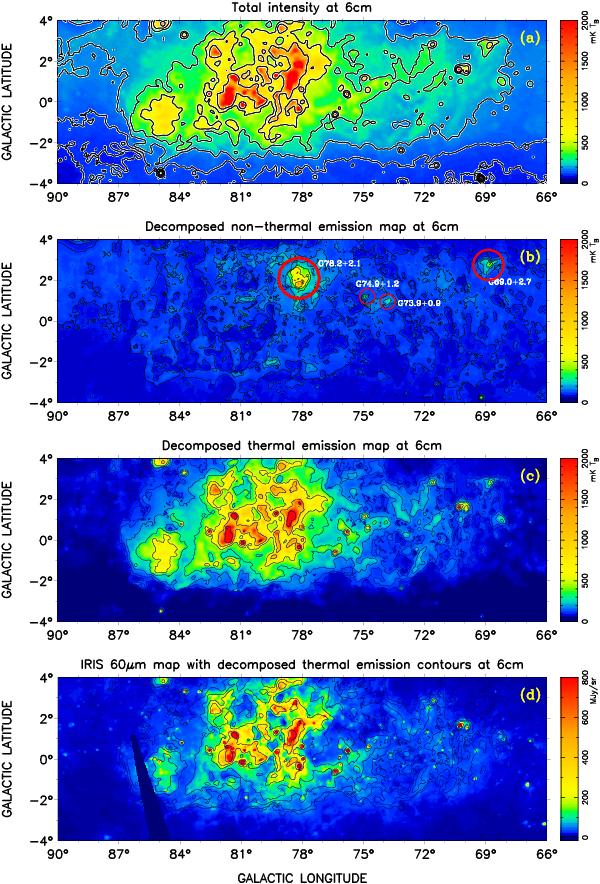
The λ6 cm radio maps of total intensity (panel a)), decomposed non-thermal (panel b)), and thermal (panel c)) emission in the Cygnus X region at an angular resolution of 95. The IRIS 60 μm image (panel d)) of the Cygnus X region is shown for comparison with the decomposed thermal map. Contours in panels a) and c) are running in steps of 70 + 2n−1 × 30 mK Tb (n = 0, 1, 2...). The contours in panel b) for non-thermal emission run in 100, 150, 200, 300, 500, and 800 mK Tb. Contours in panel d) are the same as those in panel c). The visible SNRs are indicated in panel b).
Current usage metrics show cumulative count of Article Views (full-text article views including HTML views, PDF and ePub downloads, according to the available data) and Abstracts Views on Vision4Press platform.
Data correspond to usage on the plateform after 2015. The current usage metrics is available 48-96 hours after online publication and is updated daily on week days.
Initial download of the metrics may take a while.