Fig. 5
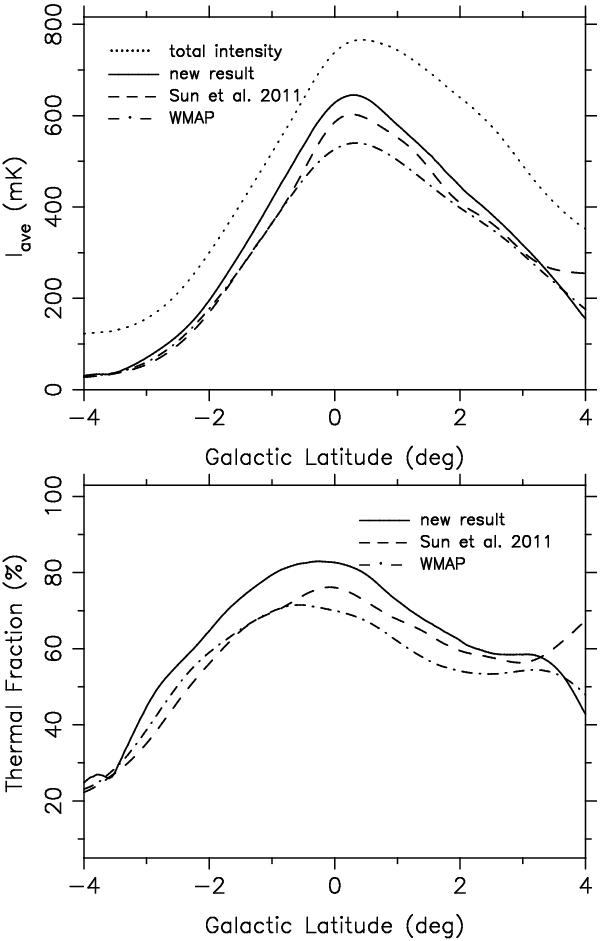
Galactic latitude profiles for the averaged intensities (upper
panel) and averaged thermal fractions (lower panel) at
λ6 cm in the Cygnus X region
( ).
The dotted line is the λ6 cm total intensity. The thermal component
derived by using our method, S11 method and the WMAP template are presented by a
solid line, a dashed line, and a dash-dot line, respectively.
).
The dotted line is the λ6 cm total intensity. The thermal component
derived by using our method, S11 method and the WMAP template are presented by a
solid line, a dashed line, and a dash-dot line, respectively.
Current usage metrics show cumulative count of Article Views (full-text article views including HTML views, PDF and ePub downloads, according to the available data) and Abstracts Views on Vision4Press platform.
Data correspond to usage on the plateform after 2015. The current usage metrics is available 48-96 hours after online publication and is updated daily on week days.
Initial download of the metrics may take a while.