| Issue |
A&A
Volume 558, October 2013
|
|
|---|---|---|
| Article Number | A82 | |
| Number of page(s) | 7 | |
| Section | Stellar structure and evolution | |
| DOI | https://doi.org/10.1051/0004-6361/201321852 | |
| Published online | 08 October 2013 | |
Optical spectropolarimetry of V4332 Sagittarii⋆,⋆⋆
1
Max-Planck Institut für Radioastronomie
Auf dem Hügel 69
53121
Bonn
Germany
e-mail:
This email address is being protected from spambots. You need JavaScript enabled to view it.
2
Department for Astrophysics, N. Copernicus Astronomical Centre, Rabiańska 8,
87-100
Toruń,
Poland
e-mail:
This email address is being protected from spambots. You need JavaScript enabled to view it.
Received:
7
May
2013
Accepted:
12
August
2013
Abstract
Context. The eruption of V4332 Sgr was observed in 1994. During the outburst, the object became extremely red, so it has been considered as to belong to red transients of the V838 Mon type. Optical spectroscopy obtained a few years after the eruption showed a faint M-type stellar spectrum underlying numerous molecular and atomic emission features. It has recently been suggested that the central object in V4332 Sgr is now hidden in a dusty disc and that the photospheric spectrum of this object observed in the optical results from scattering of the radiation of the central star on dust grains in the circumstellar matter. Recent polarimetric photometry has shown that the optical radiation of the object is indeed strongly polarized.
Aims. If it results from scattering on dust grains, the optical continuum of the object is expected to be polarized. The emission features, on the contrary – as observed directly from circumstellar regions – are expected to be unpolarized. We investigate these predictions.
Methods. We present and analyse our spectropolarimetric observations of V4332 Sgr obtained with the VLT in the optical region.
Results. The optical continuum of V4332 Sgr is linearly polarized with a typical degree of 16.6%. A clear depolarization is observed in the spectral regions where emission features contribute significantly to the observed flux. The only prominent exception is the Ca i λ6573 emission line, which is polarized in 21%.
Conclusions. The results of our spectropolarimetric observations are in accord with the proposed geometry of the system and the advocated nature of the observed optical spectrum of V4332 Sgr. The continuum is not seen directly but results from scattering on dust within the disc and polar outflow, while most of the gas emission comes from the polar outflow excited by the radiation field of the central source. Additionally, the observed polarization patterns suggest a stratification of the outflow.
Key words: line: formation / polarization / stars: individual: V4332 Sagittarii / stars: late-type / circumstellar matter
Based on observations made with ESO Telescopes at the Paranal Observatory under programme ID 087.D-0019(A).
Processed data are only available at the CDS via anonymous ftp to cdsarc.u-strasbg.fr (130.79.128.5) or via http://cdsarc.u-strasbg.fr/viz-bin/qcat?J/A+A/558/A82
© ESO, 2013
1. Introduction
The eruption of V4332 Sgr was observed in 1994 (Martini et al. 1999). Discovered as a possible classical nova, the object appeared to be unusual, mainly because of its spectral evolution. It quickly evolved from K to M spectral types and after a month declined to a very late M-type giant. The object is now classified as a red transient of the V838 Mon type (Munari et al. 2002; Tylenda et al. 2005). As discussed by Tylenda & Soker (2006), thermonuclear mechanisms (classical nova, He-shell flash) cannot explain the observed outbursts of these objects. The stellar collision-merger scenario proposed in Soker & Tylenda (2003) and further developed in Tylenda & Soker (2006) is the most promising hypothesis for explaining the nature of these eruptions. Strong arguments supporting this idea came from Tylenda et al. (2011), who showed that the eruption of V1309 Sco, another red transient, resulted from a merger of a contact binary.
More than a decade after outburst, V4332 Sgr continues to present unusual observational characteristics. Apart from displaying an M-type continuum in the optical, it shows a unique emission-line spectrum with very low excitation (Tylenda et al. 2005; Kimeswenger 2006). The object is also very bright in the infrared (Tylenda et al. 2005; Banerjee et al. 2007).
After having analysed the optical emission-line spectrum and the spectral energy distribution of V4332 Sgr, Kamiński et al. (2010) conclude that the main object, probably an M-type giant, is hidden in a circumstellar disc seen almost edge-on. The stellar-like spectrum observed in the optical probably results from scattering of the light of the central star on dust grains at the outer edge of the disc. This implies that the optical spectrum should display significant polarization. Subsequent polarimetric measurements done by Kamiński & Tylenda (2011) in the V and R photometric bands have shown that the optical light from V4332 Sgr is indeed strongly polarized (26% and 11%, respectively). As proposed in Kamiński et al. (2010), the emission-line spectrum results from radiative excitation of atoms and molecules by strong radiation of the (hidden for us) central object. Thus, unlike the observed continuum, the emission lines should be unpolarized. To verify this hypothesis, we have obtained spectropolarimetric measurements of V4332 Sgr in the optical. The results and their analysis are presented in this paper.
2. Observations and data processing
V4332 Sgr was observed with the Focal Reducer and Low Dispersion Spectrograph 2 (FORS2)
attached to the Very Large Telescope. The observations were performed on 2011 May 18 in the
linear-polarization mode in which a retarder plate is rotated in front of a Wollaston prism.
Our source was observed in two cycles, each with four retarder angles (0°, 225,
45°, and 675) and an exposition time of 290 s per angle. We used the 1200R+93
grism, which with a slit width of 1′′, provided a spectral resolution of about
λ/Δλ = 2100 and a spectral coverage
of 5800–7300 Å. Seeing during the observations was 1 1−12. The degree of
instrumental polarization was controlled by observations of a zero-polarization standard
star, WD 2039-202.
1−12. The degree of
instrumental polarization was controlled by observations of a zero-polarization standard
star, WD 2039-202.
The data reduction was performed using the standard FORS2 pipeline. It included corrections
for bias and flatfield, wavelength calibration, and extraction of spectra. The reduced
Stokes parameters were computed from the signal extracted from spectra of the ordinary
(fo) and extraordinary (fe) rays
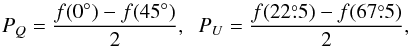 (1)where
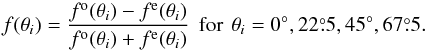 (2)The total
intensity (the Stokes I parameter) was computed as the average of all the
observed spectra. The degree of linear polarization PL and the
polarization angle PA were computed as
(2)The total
intensity (the Stokes I parameter) was computed as the average of all the
observed spectra. The degree of linear polarization PL and the
polarization angle PA were computed as
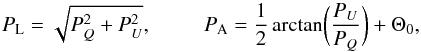 (3)where
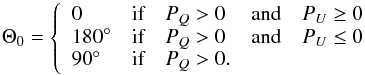 (4)The
uncertainties in PL and PA were
computed from 1σ statistical errors in the extracted spectra of the
ordinary and extraordinary rays and propagated to PL and
PA using formulae from Fossati
et al. (2007). The results from the two cycles were averaged. The flux of V4332 Sgr
turned out to be very weak, particularly at 5800–6000 Å and 6150–6350 Å. To improve the
presentation of the data here, the spectra were significantly smoothed and the polarization
parameters recalculated in the degraded resolution. Typically, we applied boxcar averaging
within 13 spectral bins.
(4)The
uncertainties in PL and PA were
computed from 1σ statistical errors in the extracted spectra of the
ordinary and extraordinary rays and propagated to PL and
PA using formulae from Fossati
et al. (2007). The results from the two cycles were averaged. The flux of V4332 Sgr
turned out to be very weak, particularly at 5800–6000 Å and 6150–6350 Å. To improve the
presentation of the data here, the spectra were significantly smoothed and the polarization
parameters recalculated in the degraded resolution. Typically, we applied boxcar averaging
within 13 spectral bins.
The derived polarization degree of the zero-polarization standard of PL = (0.42 ± 0.23)% (weighted mean and 1 rms of the residuals) agrees with the R-band catalogue value for this star (Izzo et al. 2011), PL = (0.24 ± 0.45)%, proving that the instrumental bias on PL is marginal. However, the polarization angle is known to be affected by instrumental effects (Boffin 2010), and the results were corrected for these effects using chromatic instrumental-zero points provided by the observatory (Izzo et al. 2011). The amplitude of the correction varied between 0 and 3° within the observed spectral range. Although no standard star with high polarization was observed during our observing run, constant monitoring of the instrumental polarization performed by the observatory1 assures that the applied correction is valid.
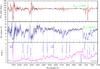 |
Fig. 1 Spectropolarimetry of V4332 Sgr. Bottom panel: the observed spectrum of the object (in arbitrary units) with the identification of the strongest emission features. Middle panel: the degree of the observed linear polarization. Top panel: the polarization angle. 1σ errors of the polarization angle and degree are shown in grey in the top and bottom panels. Horizontal dashed lines in the middle and top panels indicate mean polarization degree (16.6%) and angle (1146) of the continuum as measured in the spectral ranges marked by the horizontal bars attached to the open circles. The circles denote average values of PA (top panel) or PL (middle panel) within the individual range and the vertical errorbars represent the corresponding one standard deviation. |
3. Results
The results of our spectropolarimetric observations are shown in Fig. 1. The spectrum of V4332 Sgr, displayed in the bottom panel of the figure, covers several emission bands of metal oxides (TiO, CrO, ScO, and YO) and two features of atomic resonance lines, i.e., the marginally resolved doublet of Na i near 5993 Å and the intercombination line of Ca i at 6573 Å. For a more detailed description and analysis of the optical spectrum of V4332 Sgr, see Kamiński et al. (2010). The degree of linear polarization as a function of wavelength is presented in the middle panel, while the top panel shows the polarization angle. Flux-weighted means of the polarization degree and angle calculated for the whole observed spectrum are 15.3% ± 6.6% and 109° ± 25°, respectively. This can be compared to 11.3% ± 2.0% and 116° ± 5° obtained in Kamiński & Tylenda (2011) from the photopolarimetry of V4332 Sgr in the R band. (The spectral region of the present observations roughly corresponds to that covered by the R band.)
As can be seen from the middle panel of Fig. 1, the observed spectrum is strongly polarized. A maximum polarization degree reaches ~20%. In certain spectral regions, however, the polarization drops to almost zero (the interstellar polarization towards V4332 Sgr is discussed in Appendix A). When comparing the middle and bottom panels of Fig. 1, it is evident that the depolarization takes place in spectral regions affected or dominated by emission features. To better illustrate this, we calculated “polarized flux” defined as a product of the polarization degree and the total observed flux. The result is displayed in Fig. 2, as is a standard M5 III spectrum reddened as V4332 Sgr, i.e., with EB − V = 0.32 (Kamiński et al. 2010). As can be seen from the upper part of Fig. 2, the spectrum of the polarized flux shows an M5-type spectrum dominated by strong absorption bands of TiO. The only prominent emission feature clearly seen in the polarized flux is the λ6573 line of Ca i, but the strongest bands of CrO are also present. All other features seen in emission in the total-flux spectrum, in particular the Na i D lines, are absent in the polarized spectrum.
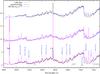 |
Fig. 2 Total and polarized spectral flux of V4332 Sgr plotted as the magenta and black curves, respectively. A standard M5 III spectrum, reddened with EB − V = 0.32, is also displayed with the blue curve for a comparison. |
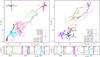 |
Fig. 3 QU plots for most prominent emission features and arbitrary chosen continuum ranges in the spectrum of V4332 Sgr. The bottom panels show the spectral location of the features for which the Stokes parameters are displayed in the top panels. The arrows shown for some features show the direction of increasing wavelength. The dashed lines cross at the plots’ origins marking the point of zero polarization. |
We also present results of our spectropolarimetric observations in terms of QU plots in Fig. 3. They present the two Stokes parameters, PQ and PU, within the profiles of the most prominent emission features and the six other spectral ranges chosen to represent the continuum. These continuum samples were chosen in spectral ranges observed at high signal-to-noise ratios, outside telluric absorption bands, and are not considerably contaminated by other emission features (checked by comparing the total-power spectrum to the standard photospheric spectrum in Fig. 2). The points representing emission features correspond to the flux of the emission feature and the underlying polarized continuum. The Stokes parameters displayed in Fig. 3 are not corrected for the instrumental chromatic polarization (Sect. 2). The points tracing the “pure” continuum occupy the high-polarization part of the QU diagrams at around (PQ,PL) = (−11, −13)%. The Stokes parameters of most of the emission features – including the Na i doublet, bands of TiO, and ScO – show a depolarization pattern and are situated in the diagram between the continuum and the graph’s origin. Additionally, within profiles of each of the analysed bands of TiO, the polarization decreases with increasing wavelength, possibly owing to the changing contribution of the photospheric spectrum underlying the bands (cf. Fig. 2; see Sect. 4). The bands of CrO show essentially the same polarization as the continuum. Somewhat anomalous is the polarization pattern observed in the emission line of Ca i, whose blue wing has the Stokes parameters consistent with those of the continuum, but the net polarization increases with wavelength so steeply that the red wing shows polarization that is even higher than that of the photospheric spectrum. The changes in the Stokes parameters within the wavelength range covered by Ca i can again be ascribed to the slope in pseudo-continuum. In the next section, we interpret these polarization characteristics and try to separate the continuum polarization from depolarization effects in emission features.
4. Analysis and interpretation
The observed strong polarization of the stellar-like continuum, and depolarization in regions dominated by emission features is consistent with the interpretation of the observed spectrum of V4332 Sgr proposed in Kamiński et al. (2010) and Kamiński & Tylenda (2011). According to the hypothesis outlined in these references, the main object, resembling an M-type giant, is surrounded by a dusty disc or disc-like envelope, most probably formed during the 1994 eruption of V4332 Sgr. The disc is seen almost edge-on, so the central object is not directly visible for us. Some amount of the material lost during the eruption is flowing out more or less along the disc axis, i.e. roughly perpendicularly to the line of sight. The observed stellar-like continuum stems from scattering the light of the central object on dust grains in the disc and the outflow. The scattering off the polar outflow, resulting at angles close to 90°, is the main cause of the observed polarization. The atomic lines and molecular bands seen in emission result from radiative excitation of atoms and molecules in the circumstellar matter by the radiation of the central star. Therefore the emission features are not expected to show any significant polarization.
Within the above scenario, the observed polarization,
PL,obs, in a given spectral region, where
the observed flux is a sum of a polarized scattered continuum and an unpolarized emission
feature, can be calculated from 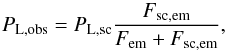 (5)where
Fem is the flux of the unpolarized emission feature while
Fsc,em is the flux of the scattered continuum
underlying the feature. The flux Fsc,em is
polarized to a degree equal to PL,sc. If
Fsc denotes a mean flux of the observed continuum measured on
both sides of the emission feature, then Eq. (5) can be rewritten as
(5)where
Fem is the flux of the unpolarized emission feature while
Fsc,em is the flux of the scattered continuum
underlying the feature. The flux Fsc,em is
polarized to a degree equal to PL,sc. If
Fsc denotes a mean flux of the observed continuum measured on
both sides of the emission feature, then Eq. (5) can be rewritten as 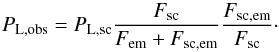 (6)Here,
Fsc/(Fem + Fsc,em)
can be measured from the observed spectrum, although we cannot be sure that the flux
measured next to the emission feature does not include weak emission features. The
Fsc,em/Fsc
ratio cannot be derived from the observations, but in most cases it can be assumed to be
equal to 1.
(6)Here,
Fsc/(Fem + Fsc,em)
can be measured from the observed spectrum, although we cannot be sure that the flux
measured next to the emission feature does not include weak emission features. The
Fsc,em/Fsc
ratio cannot be derived from the observations, but in most cases it can be assumed to be
equal to 1.
The value of PL,sc is not easy derivable from the observed spectrum because it is not straightforward to select spectral regions, which are absolutely free of emission features. Local maximum values of the polarization degree (seen in Fig. 1), which can be regarded as corresponding to the spectral places least contaminated by emission features, suggest a systematic decrease in the polarization from ~25% at the short wavelengths to ~17% at long wavelengths. These are, however, uncertain estimates, since the signal-to-noise ratio of our observations is not very high and degrades when going from long wavelengths to short ones. A decrease in the polarization degree with wavelength was also suggested in Kamiński & Tylenda (2011), who obtained a higher polarization degree in the V photometric band than in the R band (26% vs. 11%).
To obtain a more quantitative estimate of PL,sc, we selected eight wavelength regions where the spectrum seemed to be free of emission-line features. The mean polarization degree and angle derived from these regions are displayed in Fig. 1. The error bars represent standard deviations of the individual measurements from the mean values. Error-weighted mean values of the polarization degree and angle derived from all these selected regions are 16.60% ± 0.84% and , respectively. If the selected regions are affected by weak emission features, then the polarization degree of the continuum would be higher than the values we derived.
We measured mean fluxes and mean polarization degrees within the emission profiles, as well as the continuum level on both sides in the nearest vicinity of the features. The results are shown in Fig. 4, which presents the observed polarization degree of a given emission feature against the ratio of the adjacent continuum flux to the flux within the feature, i.e., Fsc/(Fem + Fsc,em) according to the notation of Eq. (6). The lines drawn in the figure show three relations calculated from Eq. (6): the full line for PL,sc = 16.6% and Fsc,em/Fsc = 1; the dashed one for PL,sc = 21.0% and Fsc,em/Fsc = 1; and the dotted one for PL,sc = 16.6% and Fsc,em/Fsc = 0.5.
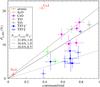 |
Fig. 4 Observed polarization degree of the emission features (PL,obs) as a function of the ratio of the continuum flux to the total flux within the line profile (Fsc/(Fem + Fsc,em)). Lines show the relations calculated from Eq. (6) for three combinations of PL,sc and Fsc,em/Fsc. See text for more details. |
Figure 4 demonstrates that the observed polarization characteristics of most emission features are well accounted for by the hypothesis that the observed spectrum of V4332 Sgr stemss from interactions of the radiation of the invisible central star with the circumstellar matter. The observed stellar-like continuum results from scattering on dust grains and is polarized at an average level of ~17%.
A somewhat higher polarization is observed in a few bands, mostly of CrO, which are situated above the full line in Fig. 4. These emission features may be partly produced near the central object. A fraction of their flux would then be scattered on dust, similarily as the photospheric spectrum, and thus would contribute to the relatively high polarization of the observed features. The polarized flux (see Fig. 2), which shows certain residuals of the CrO emission features, supports this interpretation. This is also apparent in the QU diagrams (Fig. 3), where CrO occupies the same parameter space as the continuum.
The case of the TiO bands, which mostly appear below the full line in Fig. 4, can be explained by Fsc,em/Fsc < 1.0. This means that the stellar continuum directly underlying the TiO emission features is lower than what we measured as a continuum next to the features. This is very likely given that we do see deep and wide absorption bands of TiO in the stellar-like spectrum of V4332 Sgr. The observed emission of TiO is formed near the heads of the bands, where the stellar absorption features are expected to be deepest. Indeed, the spectrum of polarized flux, as well as the standard M5 III spectrum (Fig. 2), show clear “deepenings” at the positions of the strongest TiO emission bands. As noted earlier, these steep changes in the continuum level can explain the polarization pattern observed for TiO in the QU graphs, namely that the net polarization decreases with wavelength at nearly constant polarization angle.
4.1. The anomalous polarization of the Ca I line
The general trend in Fig. 4 is that the stronger the emission line relative to the continuum, the weaker its observed polarization. The only outlier from this trend is the Ca i λ6573 line. This is the second strongest emission feature in our spectrum (after the Na i D lines), yet it shows the highest linear polarization among the emission features, i.e. 20.8% ± 0.4%. This value is higher than the mean polarization degree we obtained for the continuum (Fig. 1). It is, however, very close to the continuum polarization used to plot the dashed line in Fig. 4 and close to the highest values that can be read from the middle panel of Fig. 1. The polarization angle within the Ca i line is , which is practically the same value as for the stellar continuum (Fig. 1). Because the points in Fig. 1 may underestimate the polarization degree of the continuum, we can conclude that the polarization pattern of the Ca i λ6573 line is, within the uncertainties of our observations, the same as that of the stellar-like continuum of V4332 Sgr. This is also apparent in the QU graph (Fig. 3), where the Stokes parameters of the Ca i emission fall very close to the cluster of points corresponding to continuum, and only the red-shifted part of the Ca i profile drifts into the lower left-hand corner of the QU plot.
A straightforward interpretation of such a polarization pattern could be that the Ca i λ6573 line, unlike the rest of the observed emission features, is not produced by radiative excitation in the polar outflow but originates in the same way as the observed stellar continuum. Namely, it is emitted near the hidden central object and then scattered on dust grains in the circumstellar matter. The observed width of the Ca i line, which is about twice smaller than that of the Na i lines (Kamiński et al. 2010), may suggest that emission of the two species does not arise from the same volume of gas (with emission of Na i being more extended). This interpretation, however, raises a question of why the Na i D lines are not produced in the same way. Both the Na i and Ca i lines require similar excitation conditions (similar ionization and excitation energies in both cases, similar abundances of Na and Ca), so if the Ca i line is emitted near the central object, the Na i lines should there be produced as well – in fact, even more easily than the Ca i line, since the latter arises from an intercombination transition and has a probability of spontaneous radiative decay that is four orders of magnitude lower than the Na i lines. Nevertheless, the Na i lines show practically no polarization, which implies that the contribution of the Ca i emitting region, hypothetically placed in the immediate vicinity of the central object, to the observed emission in the Na i lines is negligible.
That the Ca i λ6573 emission develops from an intercombination transition prompts us to suggest that perhaps this is why the line is so strongly polarized compared to the Na i lines. The low probability for the radiative de-excitation of the 4p 3Po level (the upper level of Ca i λ6573) favours conditions leading to an overpopulation of the level if an effective excitation process exists. Then, it would be easy to initiate a laser-like process leading to a fast depopulation of the level through photon-stimulated transitions. If the laser-like action is initiated by the stellar photons scattered on dust grains, then all the photons emitted in the action would conserve the polarization pattern of the scattered continuum, as observed in the case of the Ca i λ6573 line. The problem, however, is that we cannot propose any physical process overpopulating the 4p 3Po level of Ca i. In addition, regions where Ca i would mainly be at this level should be hidden from the direct stellar radiation. Otherwise the laser-like action would be initiated by these direct photons rather than by those scattered on dust.
5. Conclusions
The optical spectrum of V4332 Sgr shows a significant polarization. It is primarily the stellar-like continuum that is strongly polarized. We interpret this as evidence that we do not directly observe the central object but rather the effect of scattering of its spectrum on dust grains in the circumstellar matter. Most of the molecular bands in emission and the Na i D emission lines are not polarized, since they are produced in the circumstellar gas by radiative excitation due to absorption of photons from the central star. These emission features are therefore observed directly from the polar outflow. The bands of CrO and the line of Ca i show intrinsic polarization characteristics that are similar to that of the photospheric spectrum, and therefore their emission is mostly produced close to the photosphere. Their radiation is not seen directly, because it is mostly hidden by the disc and reaches the observer only owing to scattering in the disc and in the polar outflow.
The spectrum of V4332 Sgr is the only instance where emission bands of CrO have been observed (Kamiński et al. 2010). This suggests some abundance peculiarities in the molecular envelope of this exotic object. Because the emission bands are excited by radiation, the excitation temperatures derived from optical observations (Kamiński et al. 2010) do not constrain the location of the CrO gas in the complex system of V4332 Sgr. The spectropolarimetric observations presented here locate this gas close to the star, thus providing rough but significant constraints for any model attempting to explain the chemical peculiarity of this object.
Prior to this work, only broad-band polarimetric measurements of V4332 Sgr were known. Although they revealed the high degree of linear polarization of the optical light, no information about the potential depolarization effects in emission lines was available, hampering realistic attempts to fully characterize the geometries of the scattering medium and the emitting gas. Here we were able to identify the polarization patterns in both lines and continuum, showing that the spectropolarimetric observations bear important constraints on the system’s geometry. This opens a way to construct a more detailed and quantitative model of the circumstellar environment of V4332 Sgr. Such modelling effort is pending. Knowing both the physical and chemical structure of the circumstellar vicinity of V4332 Sgr is important for better understanding of stellar-merger events and their aftermath.
Although polarization studies of emission features in dusty circumstellar environments of late-type stars are very sparse, (de-)polarization effects similar to those described here have been reported in the carbon stars R CrB and V854 Cen, where the Na i doublet and molecular bands of C2, both seen in emission, show a significant drop in polarization degree with respect to a polarized continuum (Bieging et al. 2006; Whitney et al. 1992). The polarization effects are much more pronounced in V4332 Sgr, making it a very unique object for future spectropolarimetric studies of dusty envelopes.
Acknowledgments
We thank our referee, D. Harrington, for constructive comments that helped us improve the data presentation in this paper. The research reported here has partly been supported from a grant No. N N203 403939 financed by the Polish National Science Centre.
References
- Banerjee, D. P. K., Misselt, K. A., Su, K. Y. L., Ashok, N. M., & Smith, P. S. 2007, ApJ, 666, L25 [NASA ADS] [CrossRef] [Google Scholar]
- Bieging, J. H., Schmidt, G. D., Smith, P. S., & Oppenheimer, B. D. 2006, ApJ, 639, 1053 [NASA ADS] [CrossRef] [Google Scholar]
- Boffin, H. M. J. 2010, FORS User Manual, VLT-MAN-ESO-13100-1543, Issue 87.0 [Google Scholar]
- Fossati, L., Bagnulo, S., Mason, E., & Landi Degl’Innocenti, E. 2007, The Future of Photometric, Spectrophotometric and Polarimetric Standardization, ASP Conf. Ser., 364, 503 [NASA ADS] [Google Scholar]
- Izzo, C., de Bilbao, L., & Larsen, J. M. 2011, FORS Pipeline User Manual, VLT-MAN-ESO-19500-4106, Issue 4.1 [Google Scholar]
- Kamiński, T., & Tylenda, R. 2011, A&A, 527, A75 [NASA ADS] [CrossRef] [EDP Sciences] [Google Scholar]
- Kamiński, T., Schmidt, M., & Tylenda, R. 2010, A&A, 522, A75 [NASA ADS] [CrossRef] [EDP Sciences] [Google Scholar]
- Kimeswenger, S. 2006, Astron. Nachr., 327, 44 [NASA ADS] [CrossRef] [Google Scholar]
- Landi Degl’Innocenti, E., Bagnulo, S., & Fossati, L. 2007, The Future of Photometric, Spectrophotometric and Polarimetric Standardization, ASP Conf. Ser., 364, 495 [NASA ADS] [Google Scholar]
- Martini, P., Wagner, R. M., Tomaney, A., et al. 1999, AJ, 118, 1034 [NASA ADS] [CrossRef] [Google Scholar]
- Munari, U., Henden, A., Kiyota, S., et al. 2002, A&A, 389, L51 [NASA ADS] [CrossRef] [EDP Sciences] [Google Scholar]
- Serkowski, K., Mathewson, D. S., & Ford, V. L. 1975, ApJ, 196, 261 [NASA ADS] [CrossRef] [Google Scholar]
- Soker, N., & Tylenda, R. 2003, ApJ, 582, L105 [NASA ADS] [CrossRef] [Google Scholar]
- Tylenda, R., & Soker, N. 2006, A&A, 451, 223 [NASA ADS] [CrossRef] [EDP Sciences] [Google Scholar]
- Tylenda, R., Crause, L. A., Górny, S. K., & Schmidt, M. R. 2005, A&A, 439, 651 [NASA ADS] [CrossRef] [EDP Sciences] [Google Scholar]
- Tylenda, R., Hajduk, M., Kamiński, T., et al. 2011, A&A, 528, A114 [Google Scholar]
- Whitney, B. A., Clayton, G. C., Schulte-Ladbeck, R. E., & Meade, M. R. 1992, AJ, 103, 1652 [NASA ADS] [CrossRef] [Google Scholar]
Appendix A: Interstellar polarization
Linear polarization of measured field stars.
The FORS2 slit, which consists of 15 “slitlets”, was aligned to a zero position angle. By
chance, this position allowed registering a few field stars simultaneously with V4332 Sgr
(although not all of the stars were perfectly aligned on the slit). Polarization
parameters for the brightest of them are presented in Table A.1. The polarization angle could only be determined reliably for one
star. The polarization degree of the listed stars is fairly high, possibly indicating that
the interstellar polarization in the field is relatively strong. The limited number of
measured stars and unknown distances do not allow for strong constraints on the
interstellar polarization towards V4332 Sgr, although it is likely to be ≲3%. With the
relations of Serkowski et al. (1975) and the
interstellar reddening of the object of
EB − V = 0.32 mag (Kamiński et al. 2010), we obtain the same upper limit on
the interstellar polarization of V4332 Sgr, i.e.,  . Within the uncertainties, these
limits are consistent with the lowest polarization degree observed in V4332 Sgr (within
the profile of the Na i doublet).
. Within the uncertainties, these
limits are consistent with the lowest polarization degree observed in V4332 Sgr (within
the profile of the Na i doublet).
All Tables
All Figures
|
Fig. 1 Spectropolarimetry of V4332 Sgr. Bottom panel: the observed spectrum of the object (in arbitrary units) with the identification of the strongest emission features. Middle panel: the degree of the observed linear polarization. Top panel: the polarization angle. 1σ errors of the polarization angle and degree are shown in grey in the top and bottom panels. Horizontal dashed lines in the middle and top panels indicate mean polarization degree (16.6%) and angle (1146) of the continuum as measured in the spectral ranges marked by the horizontal bars attached to the open circles. The circles denote average values of PA (top panel) or PL (middle panel) within the individual range and the vertical errorbars represent the corresponding one standard deviation. |
| In the text | |
|
Fig. 2 Total and polarized spectral flux of V4332 Sgr plotted as the magenta and black curves, respectively. A standard M5 III spectrum, reddened with EB − V = 0.32, is also displayed with the blue curve for a comparison. |
| In the text | |
|
Fig. 3 QU plots for most prominent emission features and arbitrary chosen continuum ranges in the spectrum of V4332 Sgr. The bottom panels show the spectral location of the features for which the Stokes parameters are displayed in the top panels. The arrows shown for some features show the direction of increasing wavelength. The dashed lines cross at the plots’ origins marking the point of zero polarization. |
| In the text | |
|
Fig. 4 Observed polarization degree of the emission features (PL,obs) as a function of the ratio of the continuum flux to the total flux within the line profile (Fsc/(Fem + Fsc,em)). Lines show the relations calculated from Eq. (6) for three combinations of PL,sc and Fsc,em/Fsc. See text for more details. |
| In the text | |
Current usage metrics show cumulative count of Article Views (full-text article views including HTML views, PDF and ePub downloads, according to the available data) and Abstracts Views on Vision4Press platform.
Data correspond to usage on the plateform after 2015. The current usage metrics is available 48-96 hours after online publication and is updated daily on week days.
Initial download of the metrics may take a while.