Fig. 1
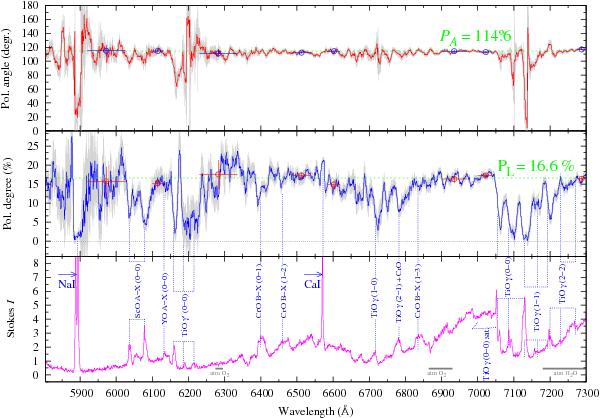
Spectropolarimetry of V4332 Sgr. Bottom panel: the observed spectrum of the object (in arbitrary units) with the identification of the strongest emission features. Middle panel: the degree of the observed linear polarization. Top panel: the polarization angle. 1σ errors of the polarization angle and degree are shown in grey in the top and bottom panels. Horizontal dashed lines in the middle and top panels indicate mean polarization degree (16.6%) and angle (1146) of the continuum as measured in the spectral ranges marked by the horizontal bars attached to the open circles. The circles denote average values of PA (top panel) or PL (middle panel) within the individual range and the vertical errorbars represent the corresponding one standard deviation.
Current usage metrics show cumulative count of Article Views (full-text article views including HTML views, PDF and ePub downloads, according to the available data) and Abstracts Views on Vision4Press platform.
Data correspond to usage on the plateform after 2015. The current usage metrics is available 48-96 hours after online publication and is updated daily on week days.
Initial download of the metrics may take a while.