Fig. 3
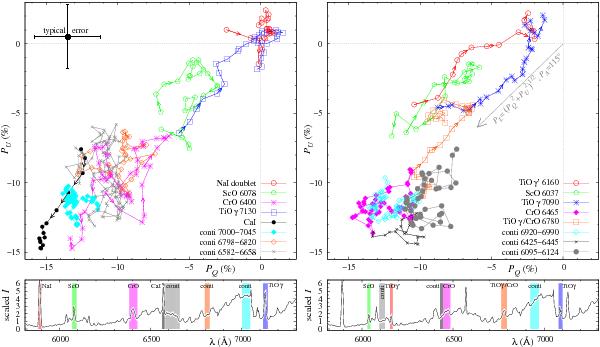
QU plots for most prominent emission features and arbitrary chosen continuum ranges in the spectrum of V4332 Sgr. The bottom panels show the spectral location of the features for which the Stokes parameters are displayed in the top panels. The arrows shown for some features show the direction of increasing wavelength. The dashed lines cross at the plots’ origins marking the point of zero polarization.
Current usage metrics show cumulative count of Article Views (full-text article views including HTML views, PDF and ePub downloads, according to the available data) and Abstracts Views on Vision4Press platform.
Data correspond to usage on the plateform after 2015. The current usage metrics is available 48-96 hours after online publication and is updated daily on week days.
Initial download of the metrics may take a while.