| Issue |
A&A
Volume 558, October 2013
|
|
|---|---|---|
| Article Number | A81 | |
| Number of page(s) | 8 | |
| Section | Interstellar and circumstellar matter | |
| DOI | https://doi.org/10.1051/0004-6361/201321498 | |
| Published online | 07 October 2013 | |
Fragmentation, infall, and outflow around the showcase massive protostar NGC 7538 IRS1 at 500 AU resolution ⋆,⋆⋆
Max-Planck-Institute for Astronomy,
Königstuhl 17,
69117
Heidelberg,
Germany
e-mail:
name@mpia.de
Received: 18 March 2013
Accepted: 5 August 2013
Aims. Revealing the fragmentation, infall, and outflow processes in the immediate environment around massive young stellar objects is crucial for understanding the formation of the most massive stars.
Methods. With this goal in mind we present the so far highest spatial-resolution thermal submm line and continuum observations toward the young high-mass protostar NGC 7538 IRS1. Using the Plateau de Bure Interferometer in its most extended configuration at 843 μm wavelength, we achieved a spatial resolution of 0.2″ × 0.17″, corresponding to ~500 AU at a distance of 2.7 kpc.
Results. For the first time, we have observed the fragmentation of the dense inner core of this region with at least three subsources within the inner 3000 AU. The outflow exhibits blue- and red-shifted emission on both sides of the central source, indicating that the current orientation has to be close to the line-of-sight, which differs from other recent models. We observe rotational signatures in northeast-southwest direction; however, even on scales of 500 AU, we do not identify any Keplerian rotation signatures. This implies that during the early evolutionary stages any stable Keplerian inner disk has to be very small (≤500) AU). The high-energy line HCN(4−3)v2 = 1 (E − u/k = 1050 K) is detected over an extent of approximately 3000 AU. In addition to this, the detection of red-shifted absorption from this line toward the central dust continuum peak position allows us to estimate infall rates of ~1.8 × 10⁻³ M⊙ yr-1 on the smallest spatial scales. Although all that gas will not necessarily be accreted onto the central protostar, nevertheless, such inner core infall rates are among the best proxies of the actual accretion rates one can derive during the early embedded star formation phase. These data are consistent with collapse simulations and the observed high multiplicity of massive stars.
Key words: stars: formation / stars: early-type / stars: individual: NGC 7538IRS1 / stars: massive
Based on observations carried out with the IRAM Plateau de Bure Interferometer. IRAM is supported by INSU/CNRS (France), MPG (Germany) and IGN (Spain).
Data in FITS format are available at the CDS via anonymous ftp to cdsarc.u-strasbg.fr (130.79.128.5) or via http://cdsarc.u-strasbg.fr/viz-bin/qcat?J/A+A/558/A81
© ESO, 2013
1. Introduction
High-mass stars are known to usually form as multiple objects in the center of dense clusters (e.g., Zinnecker & Yorke 2007). With their large energy output throughout their whole lifetime and their clustered nature, they are among the most important ingredients of the Milky Way and extragalactic systems. However, their actual formation processes are still not well constrained (e.g., McKee & Ostriker 2007; Beuther et al. 2007a; Zinnecker & Yorke 2007). Particularly important questions relate to the fragmentation of the innermost dense cores and the formation of massive accretion disks (e.g., Krumholz et al. 2007b, 2009; Beuther et al. 2007b; Bontemps et al. 2010; Peters et al. 2010; Commerçon et al. 2011; Kuiper et al. 2011, 2012). While Keplerian accretion disks have been found from low- to intermediate-mass star-forming regions (e.g., Simon et al. 2000; Schreyer et al. 2002; Cesaroni et al. 2005), high-mass star-forming regions have so far usually exhibited non-Keplerian rotation signatures on scales between a few 1000 AU and 0.1 pc (e.g., Cesaroni et al. 2007; Fallscheer et al. 2009; Beltrán et al. 2011). Since collimated outflows also exist in high-mass star formation (e.g., Beuther et al. 2002b,a; Zhang et al. 2005), and these outflows require stable inner accretion disks for the launching (e.g., Vaidya et al. 2009), Keplerian disks are also expected around young high-mass stars with masses >8 M⊙. That the latter are still observationally not detected in thermal line emission indicates that these stable Keplerian structures are likely smaller than the previous spatial resolution limit of thermal line emission on the order of several 1000 AU. Interestingly, our target source NGC 7538 IRS1 exhibits velocity signatures consistent with a Keplerian disk observed in non-thermal maser emission on much smaller spatial scales (Pestalozzi et al. 2004). However, these maser features are controversially discussed and are ambiguous (see next paragraph, De Buizer et al. 2005; Pestalozzi et al. 2009).
Addressing this spatial resolution challenge, we studied one of the best northern hemisphere high-mass accretion disk candidates NGC 7538 IRS1 with the Plateau de Bure Interferometer (PdBI) in the 1.3 mm wavelength window at ~0.3″ (Beuther et al. 2012a). At the approximate distance of ~2.7 kpc (Moscadelli et al. 2009; Puga et al. 2010), this corresponds to a linear resolution of ~800 AU. NGC 7538 IRS1 had already previously been extensively investigated. The central energy source is estimated to be an O6 star with a mass of ~30 M⊙ and a luminosity of ~8 × 10⁴ L⊙ (e.g., Willner 1976; Campbell & Thompson 1984; Gaume et al. 1995; Pestalozzi et al. 2004; Sandell & Sievers 2004; Reid & Wilson 2005). While Campbell (1984), Gaume et al. (1995) and Sandell et al. (2009) report an ionized jet in the north-south direction, Minier et al. (2000) and Pestalozzi et al. (2004, 2009) present the detection of CH3OH class II masers at 6.7 and 12.2 GHz, which is indicative of an accretion disk perpendicular to the outflow. Partly different interpretations arise from mid-infrared continuum imaging (De Buizer & Minier 2005) that detect a disk-like structure in the northeast-southwestern direction perpendicular to the molecular outflow (Keto 1991; Davis et al. 1998). Figure 1 shows the various outflow/disk axes discussed in the literature so far. Setting high-spatial-resolution near-infrared speckle images of the region into context with the existing data, Kraus et al. (2006) propose precession of the underlying disk-jet structure as the main reason for observing different axis orientations. Furthermore, Hoffman et al. (2003) report high-spatial-resolution observations of the rare H2CO maser emission that is also consistent with a very young disk candidate (cf. Araya et al. 2007). In addition to the proposed CH3OH maser disk, Minier et al. (2000) identified a few additional CH3OH maser positions, several of them approximately in the east-west direction but one also in the south of the core (Fig. 1). All these additional maser components are blue-shifted with respect to the vlsr and the southern position is said to be associated with the ionized north-south jet (Minier et al. 2001). Qiu et al. (2011) observed red-shifted absorption toward NGC 7538IRS, which they interpret as infall motions of the dense gas.
Resolving this region with the PdBI in the 1.3 mm continuum emission, as well as several spectral lines at ~800 AU resolution, the source still remains one compact continuum core without evidence of significant fragmentation (Beuther et al. 2012a). Furthermore, in the dense gas spectral lines, we identified a velocity gradient in the northeast-southwest direction that is consistent with the mid-infrared disk hypothesis of De Buizer & Minier (2005). However, the velocity profiles are strongly affected by absorption against the strong continuum, which made interpretating of velocity structures from a potential disk almost impossible. Nevertheless, the absorption profiles allowed us to estimate approximate mass infall rates on the order of 10-2 M⊙ yr-1.
Based on these exciting results, we now aim to resolve and study this promising massive disk candidate at the highest spatial resolution possible in pre- and early-ALMA (Atacama Large Millimeter Array) time, as well as in higher excited lines that may not be as affected by the absorption than the lines of the previous studies. It should also be noted that this important northern-sky star-forming region will never be accessible with ALMA. Therefore, we observed NGC 7538 IRS1 at the shortest wavelengths accessible with the PdBI at 843 μm in its most extended configuration. These observations resolve the submm continuum and spectral line emission (HCN(4−3)v2 = 1, CH3OH(151,14−150,15) and HCO+(4−3)) at previously unaccessible 0.2″ × 0.17″ spatial resolution corresponding to linear resolution elements of ~500 AU. Questions we are addressing with these observations are: what are the fragmentation properties of the innermost core region? What are the rotational properties of that entity? How does the innermost outflow structure relate to the rotational structure?
2. Observations
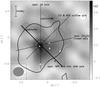 |
Fig. 1 PdBI 843 μm continuum image toward NGC 7538 IRS1. The full line contour levels start at 3σ values and continue in 1σ steps of 50 mJy beam-1 (black contours from 3 to 9σ, white contours from 10 to 14σ). The dashed contour shows the same negative levels. The thick full line presents the 4σ contour (1σ ~ 29 mJy beam-1) from the 1.36 mm data presented in Beuther et al. (2012a). Several potential disk and outflow axes reported in the literature are presented (Davis et al. 1998; De Buizer & Minier 2005; Sandell et al. 2009; Pestalozzi et al. 2004, 2009; Sandell & Wright 2010, see Introduction for more details). The thick line presents the axis along which the position-velocity diagrams in Fig. 4 are conducted. The northern and northwestern peaks submmN and submmNW are labeled, and the open star, the six-pointed star, and the white triangles mark the positions of the OH, H2CO, and additional CH3OH masers (Argon et al. 2000; Hoffman et al. 2003; Minier et al. 2001). A scale-bar and the synthesized beam (0.2″ × 0.17″) are shown as well. The 0/0 position is the phase reference center in Sect. 2. |
NGC 7538 IRS1 was observed, together with NGC 7538S, in a shared-track mode in A configuration on February 27, 2012. The phase center of NGC 7538 IRS1 was RA (J2000.0) 23h 13m 45.360s, Dec (J2000.0) 61° 28′ 10.55″. Phase calibration was conducted with regularly interleaved observations of the quasars 0059+581, 0016+731, and 2320+506. The bandpass and flux were calibrated with observations of 3C 279. The absolute flux level is estimated to 20% accuracy. The continuum emission was extracted from apparently line-free broad band data obtained with the WIDEX correlator with four units and two polarizations covering the frequency range from 354.16 to 357.77 GHz. The 1σ continuum rms for NGC 7538 IRS1 is 50 mJy beam-1. To extract kinematic information, we put several high-spectral resolution units with a nominal resolution of 0.312 MHz or 0.26 km s-1 into the bandpass covering the spectral lines with upper level energies Eu/k between 43 and 1050 K (Table 1). The spectral line rms for 1.0 km s-1 wide spectral channels measured in emission-free channels, as well as channels with emission, varies between 30 and 55 mJy beam-1. The vlsr is ~−57.3 km s-1 (Gerner et al. 2013; van der Tak et al. 2000; Sandell & Wright 2010). The data were inverted with a “robust” weighting scheme and cleaned with the Clark algorithm. The synthesized beam of the final continuum and line data is ~0.2″ × 0.17″ (PA 93°). While NGC 7538 IRS1 is extraordinarily strong in line and continuum emission, NGC 7538S is much weaker – it was not detected in the spectral lines – and even imaging of the continuum was difficult. Therefore, we do not discuss the NGC 7538S data.
Observed spectral lines.
3. Results and discussion
3.1. Fragmentation of the innermost core in the 843 μm continuum emission
Figure 1 presents the highest angular-resolution submm continuum image (843 μm or 356 GHz) that has, to the authors’ knowledge, ever been obtained from a high-mass protostar and disk region. The synthesized beam of 0.2″ × 0.17″ corresponds at the given distance of 2.7 kpc to a spatial resolution element of approximately 500 AU. For the first time, therefore, time we resolve the structures where not only the massive dense cores but also the proposed embedded high-mass disks are expected to fragment (e.g., Krumholz et al. 2007a).
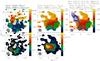 |
Fig. 2 Color scales in the left panels present the 0th moment (bottom, integrated intensity) and 1st moment (top, intensity weighted velocity) maps of the HCN(4–3)v2 = 1 emission. In the middle and right panels, the color-scale shows the 0th and 1st moment maps (bottom and top, respectively) of CH3OH(151,14−150,15). Black contours in all panels outline the dust continuum emission (Fig. 1) starting at the 3σ level and continuing in 2σ steps. The blue and red contours in the right panel show the blue- and red-shifted HCO+(4−3) emission integrated over the velocity regimes written above the panel. Contouring is done from 10 to 90% of the respective peak emission. The white triangles present the additional maser positions by Minier et al. (2000), and a beam and scale bar are presented as well. The CH3OH 1st moment map also marks the axis along which the position-velocity cuts in Fig. 4 are conducted. |
While the lower resolution 1.36 mm image in Beuther et al. (2012a) consisted mainly of an unresolved point source with only very little extended emission at low intensities, the new 843 μm data now reveal substructure within the inner ~3000 AU of the region. In addition to spatially resolving the central peak into an elongated structure with a subpeak about 0.3″ (~900 AU) north of the main peak (Fig. 1), there appears to be a secondary structure toward the northwest of the main peak. While the arm-like structure is at the 3–4σ level, the northwestern peak of that arm (offset −0.11″/0.36″ or ~1300 AU, labeled submmNW in Fig. 1) is above 5σ. The lowest 4σ contour of the previous 1.36 mm data (1σ ~ 29 mJy beam-1, Beuther et al. 2012a) shows only a weak extension in that direction. The peak 843 μm flux from submmNW is ~0.27 mJy beam-1, and assuming a ν4 flux dependence at (sub)mm wavelength, translates into a 1.36 mm flux of ~40 mJy beam-1. This is below the 2σ level of the previous 1.36 mm data, so it explains the non-detection at the longer wavelengths. The detection of fragmenting substructure in the dense core/disk at the shorter wavelengths shows the power of this wavelength range.
The peak and integrated (above 3σ level) 843 μm fluxes extracted from Fig. 1 are 0.74 Jy beam-1 and 3.38 Jy, respectively. At the given spatial resolution, the peak and 3σ fluxes of 0.74 and 0.15 Jy beam-1 correspond to brightness temperatures from the peak to the edge between 219 and 51 K. Reid & Wilson (2005) report an 850 μm single-dish continuum peak flux of 18.1 Jy beam-1, which implies that our interferometer observations filter out approximately 80% of the total flux. To calculate masses and column densities, it is important to estimate the free-free contribution to the total flux measured at the given wavelengths. While the free-free emission has approximately a ν2 dependence in the optically thick regime, it turns almost flat (ν-0.1) in the optically thin regime. As a result, if one knows the turnover frequency between the two regimes such an estimate is relatively easy. However, that turnover frequency has not been determined yet for NGC 7538 IRS1. Sandell et al. (2009) compiled the cm wavelength fluxes and find rising fluxes up to 43.4 GHz where they measure a flux of ~430 mJy toward the central elongated but still compact core (size 0.2″ × 0.14″, smaller than our synthesized beam). This value can be considered as a lower limit of the free-free contribution even at submm wavelengths. But because the spectral energy distribution has not reached the optically thin regime at that wavelength yet, giving an upper limit is difficult. In our previous 1.36 mm study we assumed 1 Jy as a free-free flux contribution; however, that is obviously too high because we only measure 0.74 Jy beam-1 peak flux in our new submm PdBI data. As an approximation, we assume 0.5 Jy as a free-free flux contribution at 843 μm, which results in a dust-related peak and integrated fluxes at that wavelength of 0.24 Jy beam-1 and 2.88 Jy, respectively. Interestingly, after correcting for the free-free emission, the dust related 843 μm peak flux from the central peak is very close to that measured from the northern peak (submmN) with ~0.26 mJy beam-1 and the northwestern extension peak (submmNW) with ~0.27 mJy beam-1. While even submmN and submmNW may make free-free contributions to the measured flux, based on the published cm data, this potential contribution should be very small (Sandell et al. 2009).
Assuming optically thin emission of dust at submm wavelength at an approximate temperature of 245 K (Qiu et al. 2011) with a dust opacity κ ~ 1.8 cm2 g-1 (extrapolated from Ossenkopf & Henning 1994 for densities of 106 cm-3 and dust with thin ice mantles) and a gas-to-dust mass ratio of 186 (Jenkins 2004; Draine et al. 2007), the integrated flux corresponds to a total mass of the submm structure of ~11 M⊙. Using the peak fluxes to estimate the mass contributions of resolved fragments (central submmN and submmNW), they have similar values with 0.9, 1.1, and 1.0 M⊙, respectively. The gas column densities toward the central peak, as well as submmN and submmNW, are approximately the same with 0.9 × 1025, 1.0 × 1025, and 1.0 × 1025 cm-2, respectively. This corresponds to very high visual extinction values around 105 mag. For comparison, assuming ISM dust properties (Mathis et al. 1977) in the classical Hildebrand (1983) picture the masses and column densities would be higher with values of ~25 M⊙, 2.0 × 1025, 2.1 × 1025, and 2.2 × 1025 cm-2, respectively. Independent of the assumed dust properties, the detection of a central infrared source (e.g., Puga et al. 2010), in spite of such extremely high gas column density and extinction values, indicates that the outflow is likely to be aligned not to far off the line-of-sight excavating a cavity through which we can peer into the center (see Sect. 3.2.3).
In addition to the fragmenting structures on 1000 AU scales, the extremely high spatial resolution of this continuum map also reveals an elongation of the central peak around NGC 7538 IRS1. At the >10σ level, the 843 μm emission appears elongated along an axis approximately inbetween the north-south jet axis and the northeast-southwest mid-infrared and molecular disk axis marked in Fig. 1. This orientation of the elongation reflects the likely situation that the submm emission receives contributions from the assumed underlying dusty disk, as well as from the ionized jet. However, we cannot exclude that the elongation could also be due to an unresolved binary. Kraus et al. (2006) do not find any equal brightness binary at their spatial resolution limit of 70 mas, but their proposed precession model requires a very close and unresolved binary component. Furthermore, the data reveal elongated and more extended emission ~0.3″ east of the main peak. While this emission can be part of the smoother envelope emission, it may also host another unresolved subsource in the region.
The fragmenting core structure is consistent with – if not a prerequisite for – the observed high degree of multiplicity and Trapezia systems in high-mass star formation (e.g., Zinnecker & Yorke 2007). While fragmentation can also be suppressed, for example, by magnetic fields (e.g., Commerçon et al. 2011), recent hydrodynamical simulations of collapsing gas clumps predict the fragmentation of the rotating cores/disks and even competitive accretion between the different subfragments within the disk (Krumholz et al. 2009; Peters et al. 2010). The model-predicted fragmentation scales of the inner core/disk structures range between several 100 and a few 1000 AU, resembling the observed structures fairly closely.
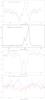 |
Fig. 3 Top three continuum-subtracted spectra are extracted for HCN, CH3OH and HCO+ toward the central peak position (offset 0.1″/−0.2″). Bottom spectrum: the HCO+ spectra from the blue- and red-shifted outflow peak positions presented in Fig. 2 (offsets positions 0.33″/0.18″ and −0.18″/−0.48″, respectively). |
3.2. Gas kinematics
The spectral line data allow us to investigate the gas kinematics of the different components in more detail. Figure 2 gives an overview of the HCN(4−3)v2 = 1), CH3OH(151,14−150,15), and HCO+(4−3) results. While we show for HCN(4−3)v2 = 1 and CH3OH(151,14−150,15) zeroth (integrated intensity) and first moment maps (intensity-weighted velocities), the blue- and red-shifted high-velocity gas is presented for HCO+(4−3). Figure 3 additionally shows the spectra of all three lines extracted toward the continuum peak, as well as the HCO+(4−3) spectra toward the blue- and red-shifted outflow peak positions.
While both high-density tracers – HCN(4−3)v2 = 1 and CH3OH(151,14−150,15) – clearly show the northeast-southwest velocity gradient of the underlying rotating core/disk structure on scales of approximately 3000 AU, it is interesting that the highest excited HCN(4−3)v2 = 1 line with an upper energy level Eu/k of 1050 K still exhibits the central absorption features. Considering the peak brightness temperature of the continuum emission of 219 K, this implies that the beam-averaged excitation temperature of the spectral line has to be lower than that. At the high densities within the core, the same applies to the beam-averaged gas kinetic temperatures. The Eu/k = 278 K CH3OH(151,14−150,15) line is among the few lines that do not show any absorption at high spatial resolution. From the suite of lines presented in Beuther et al. (2012a), that covers a broad range of energy levels between 21 and 326 K, only the optically thin methyl-cyanide isotopologue CH CN did not show any prominent absorption feature. Since the CH3OH(151,14−150,15) line is very strong and probably not optically thin, it does not seem to be an optical depth effect here. Why this line does not show up in absorption is not exactly clear yet. However, it is known that many CH3OH transitions are potential masers. One condition for the inversion population for masers is a negative excitation temperature. On the way to inversion population, the excitation temperature first asymptotically rises to high Tex (e.g., Stahler & Palla 2005, Fig. 14.6) before it inverts and becomes negative. Hence, even in the non-masing state, a molecule like CH3OH may more easily exhibit high excitation temperatures and thus less absorption than most other molecules. Independent of that, the CH3OH emission line is very useful for studying the rotational properties of the core without absorption artifacts.
3.2.1. Rotational properties
While a rotating inner envelope and/or disk structure is already evident from the first moment map (Fig. 2), to investigate whether a Keplerian accretion disk can be identified with the new data, Fig. 4 presents position-velocity cuts for HCN(4−3)v2 = 1) and CH3OH(151,14−150,15) along the northeast-southwest axis most likely representing the orientation of the proposed embedded disk. This axis is not exactly aligned with the extension of the continuum emission (Sect. 3.1), but it is the axis of the strongest velocity gradient (Figs. 1 and 2). Although we identify a clear velocity gradient across the core, thereby confirming its general rotation, the position-velocity diagram is not consistent with Keplerian rotation, but the data instead exhibit sub-Keplerian motions of the gas. To visualize this, Fig. 4 shows the position-velocity signatures one would expect for a central 30 M⊙ and 8 M⊙ star. Obviously, none of these rotation curves fits the observations, which implies that we still miss clear signatures of a Keplerian accretion disk around genuine high-mass young stellar objects.
While Keplerian disks have been identified and studied intensively for low-mass TTauri stars (e.g., Simon et al. 2000), Keplerian rotation has been identified only in a few cases around early B-type stars (e.g., AFGL490 or IRAS 20126, Schreyer et al. 2002; Cesaroni et al. 2005). However, in the high-mass regime mainly larger scale rotating toroids have been found (e.g., Cesaroni et al. 2007; Fallscheer et al. 2009). Recently, a large PdBI survey of several low-mass class 0 sources did not identify any Keplerian disk on scales larger than 50 AU (Maury et al. 2010, Maury et al., in prep.). This implies that the real Keplerian disks around very young low-mass protostars have to be very small in size. Extrapolating this picture to the high-mass sources, we have also not found Keplerian disks on scales >500 AU. One should keep in mind that the rotating envelope mass of around 11 M⊙ is a significant fraction of the reported stellar mass of 30 M⊙ (which is an upper limit because the mass estimates based on the luminosity do not properly take the potential accretion luminosity into account). Since a requirement for Keplerian rotation is that the disk mass is negligible compared to the mass of the central object, real Keplerian signatures may not even be expected on these larger scales. Since in both the low-mass and high-mass cases, collimated outflows are known that indicate stable disks for their launching, in the high-mass case we also have to achieve better spatial resolution and search for these entities on still smaller scales. Small inner Keplerian disks are also consistent with near-infrared spectral line observation results (e.g., Thi & Bik 2005; Wheelwright et al. 2010; Ilee et al. 2013.) In principle, one could fathom such a small inner accretion disk also in the ionized gas, however, high-spatial-resolution recombination line studies of this region also exhibit the north-south jet-structure with very broad recombination lines (Gaume et al. 1995). These are more straightforwardly interpreted in the framework of an outflow/wind model for the ionized gas.
It is interesting to note that the additional blue-shifted CH3OH maser components that are not part of the proposed Keplerian disk but found a bit offset (Figs. 1 and 2, Minier et al. 2000, 2001) are spatially and velocity-wise correlated with the rotating gas observed in HCN and CH3OH and less with the inverse velocity-structure seen in HCO+. This strongly indicates that the masers are not part of the outflow but of the inner rotating core.
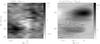 |
Fig. 4 Position-velocity diagrams for HCN(4–3)v2 = 1 (left) CH3OH(151,14−150,15) (right) along the northeast-southwest, mid-infrared and molecular axis shown in Fig. 1. The full and dashed lines mark the rotation curves for embedded 30 and 8 M⊙ objects, respectively. The vlsr is shown as well. |
3.2.2. Infall rates
The HCN(4−3)v2 = 1 spectrum extracted toward the submm peak positions exhibits clear blue- and red-shifted absorption signatures. Knez et al. (2009) found similar spectral absorption signatures in spectral line observations at mid-infrared wavelengths, and they interpret their data in the framework of absorption from a nearly edge-on disk. We think that the expected underlying embedded disk-structure is currently unlikely to be too close to edge-on but has to have a considerable inclination angle mainly for two reasons: (1) If a flattened disk-like structure were fully edge-on, the central source would be highly extincted and no or barely any emission would be expected to escape at near-infrared wavelengths. In contrast to that picture, near-infrared observations detect a central source (e.g., Puga et al. 2010). While the infrared emission could also in principle be due to scattered light from the outflow cone (e.g., Kraus et al. 2006), a simpler way to explain such a detection in the presence of high column densities and extinctions (as reported in Sect. 3.1) is that one observes the region at least at medium inclination through the cleared-out outflow cavity. (2) Furthermore, the velocity structure observed in HCO+(3–2) (see Sect. 3.2.3) indicates that we have to look at least to some degree into the cavity of the outflow. An additional aspect of the whole region to be considered is the strong precession of the disk-outflow system proposed by Kraus et al. (2006). While such precession cannot only change the projected angle of the outflow on the plane of the sky, it would also change the inclination to the observer. Hence, in this precession model it is possible that the outflow cone is closer to the line-of-sight during different time steps in the evolution of the system.
Therefore, we favor a geometry with the outflow orientation being closer to the line of sight where any flattened disk-like structure has to be closer to face-on. Deriving an exact inclination angle is not possible with the given data. In this framework, the blue-shifted absorption should stem from outflowing gas, whereas the red-shifted absorption indicates infalling gas. Observing this infall in a line with Eu/k higher than 1000 K implies that the infall continues down to the innermost region around the star. Although it is unclear what fraction of the gas will finally be accreted, infall rates estimated from these signatures should give an upper limit for the actual accretion rates.
Assuming a spherical infall geometry, one can estimate mass infall rates via Ṁin = 4πr2ρvin where Ṁin and vin are the infall rate and infall velocity, and r and ρ the core radius and density (see also Qiu et al. 2011; Beuther et al. 2012a). We estimate the radius as r = 250 AU, which is half our spatial resolution limit, corresponding well to the area where absorption is present (Fig. 2, left panels). The estimated density ρ ~ 1.2 × 109 cm-3 results from assuming that the peak column density derived above is distributed along the line-of-sight at our spatial-resolution limit, i.e., 500 AU. The infall velocity can be estimated to 3.2 km s-1, which corresponds to the difference between the most red-shifted absorption at ~−54.1 km s-1, and the vlsr ~ −57.3 km s-1. With these numbers, we derive an infall rate of Ṁin ~ 3.6 × 10⁻³ M⊙ yr-1. This estimate is approximately a factor 20 lower than the infall rates derived previously from the 1.36 mm line data (Beuther et al. 2012b). The main difference stems from the higher spatial resolution of the new data that enters the equation for Ṁin through r2. Adding in the higher upper level energy of the HCN(4−3)v2 = 1 line, the new value should resemble the actual accretion rates better than the previous estimate. To additionally improve our 1D spherical infall estimate into a 2D disk geometry, we follow the arguments given in Beuther et al. (2012b): considering that the accretion does not occur in a spherical mode over 4π but rather along a flattened disk structure with a solid angle of Ω, the actual disk infall rates Ṁdisk,in should scale like  . Based on the simulations by Kuiper et al. (2012) and Kuiper (priv. comm.), the outflow covers approximately an 120 degree opening angle, and the disk 60 degree (to be doubled for the north-south symmetry). Since the opening angle does not scale linearly with the surface element, full integration results in ~50% or ~2π of the sphere being covered by the disk. This then results in disk infall rates of Ṁdisk,in ~ 1.8 × 10⁻³ M⊙ yr-1, which is still very high and in the regime of accretion rates required to form high-mass stars (e.g., Wolfire & Cassinelli 1987; McKee & Tan 2003).
3.2.3. Outflow properties
The blue- and red-shifted outflow signatures in the H CO+(4–3) line in the northeast-southwest direction come as a surprise at first sight. They appear aligned with the northeast-southwest axis of the rotating structure, almost perpendicular to the CO and mid-infrared outflow and still at a considerable angle to the ionized jet. The facts that the HCO+ velocities are significantly higher than the rotational velocities measured in this direction by the CH3OH and HCN lines, as well as the inversion of blue- and red-shifted gas with respect to the rotational structure, strongly indicate that the HCO+ emission traces different gas than do the other presented lines.
Additional information can be extracted from the spectra taken toward the blue- and red-shifted peak positions (Fig. 3). These spectra clearly show the blue- and red-shifted line wings, but both spectra exhibit additional emission components. The spectrum toward the blue-shifted peak position has another component at ~−51.3 km s-1 that is red-shifted with respect to the vlsr. Correspondingly, the spectrum extracted from the red-shifted peak exhibits an additional emission component at ~−78.6 km s-1 that is extremely blue-shifted compared to the vlsr. Combining these two spectra, we see that both lobes exhibit blue- and red-shifted emission. In an outflow scenario, this indicates that the outflow is aligned almost along the line-of-sight and that emission from both outflow lobes is found within the same observational beams. The projected molecular HCO+ outflow geometry indicated by Fig. 2 thus does not really reveal the actual outflow geometry, but the outflow has to be aligned closer to the line-of-sight. This agrees well with the fact that we see infrared emission from a central object (e.g., Linz et al. 2009; Puga et al. 2010) from a region with such high column densities, hence visual extinction (see Sect. 3.1) that should prohibit any emission at short wavelengths. With an outflow cone along the line-of-sight, the near-infrared emission can easily escape and reach the observer (e.g., Hofner et al. 2001; Linz et al. 2005).
As already discussed in Sect. 3.2.2, the proposed precession of the system has to be taken into account as well (Kraus et al. 2006). This implies that the inclination of the outflow cone with respect to the line-of-sight can vary during different time steps in the evolution of the system.
4. Conclusions
These so far highest spatial-resolution submm observations of the dense dust and thermal gas around a high-mass protostar reveals several exciting results. For the first time, we have resolved fragmentation properties of the rotating inner core with at least three subsources within the inner 3000 AU. This is consistent with the high degree of multiplicity found for high-mass stars. The region also resembles structures found recently in hydrodynamical simulations of collapsing gas clumps. In addition to the fragmentation results, the data also clearly outline the importance of going to shorter wavelengths to identify such fainter structures because the ν4 frequency dependence strongly outweights the poorer atmospheric conditions at shorter wavelengths.
Identifying red-shifted absorption signatures of infall motions from a high-excitation temperature (Eu/k ~ 1050 K) tracer like the HCN(4−3)v2 = 1 line on scales ≤500 AU from the central protostars allows us to estimate infall rates around 1.8 × 10⁻³ M⊙ yr-1. Although it is unclear what fraction of the gas actually falls on the star, such inner core/disk infall rates are among the best proxies of the actual accretion rates we can get at that early evolutionary stage.
The outflow exhibits blue- and red-shifted emission on both sides of the central object. This can only be explained by an outflow cone opening almost along the line-of-sight, hence emitting blue- and red-shifted gas within the same observational beam. Such a line-of-sight outflow is also prerequisite for the simultaneous detection of extremely high visual extinction values (on the order 105 mag) and at the same time infrared emission from the central object.
Collimated and jet-like outflows are usually considered to require stable central, most likely Keplerian disks, and the search for these objects is still open. Although we clearly identify rotational signatures of the core on ~3000 AU scales, even at our resolution limit of 500 AU we are not able to identify Keplerian velocity signatures. The difficulty to identify disks during early evolutionary stages has also recently been reported for low-mass class 0 sources (Maury et al., in prep.). Identifying and studying these low- and high-mass accretion disks during the earliest evolutionary stages remains one of the exciting topics in high-mass star formation for the coming years.
While these observations are at the edge of the capabilities of currently existing (sub)mm interferometers, they outline the immense potential of ALMA and NOEMA in that field.
Acknowledgments
We would like to thank the IRAM staff, in particular Jan Martin Winters, for all support during the observation and data reduction process. Furthermore, we acknowledge the referee’s report and comments that improved the paper.
References
- Araya, E., Hofner, P., Goss, W. M., et al. 2007, ApJS, 170, 152 [NASA ADS] [CrossRef] [Google Scholar]
- Argon, A. L., Reid, M. J., & Menten, K. M. 2000, ApJS, 129, 159 [NASA ADS] [CrossRef] [Google Scholar]
- Beltrán, M. T., Cesaroni, R., Neri, R., & Codella, C. 2011, A&A, 525, A151 [NASA ADS] [CrossRef] [EDP Sciences] [Google Scholar]
- Beuther, H., Schilke, P., Gueth, F., et al. 2002a, A&A, 387, 931 [NASA ADS] [CrossRef] [EDP Sciences] [Google Scholar]
- Beuther, H., Schilke, P., Menten, K. M., et al. 2002b, ApJ, 566, 945 [NASA ADS] [CrossRef] [Google Scholar]
- Beuther, H., Churchwell, E. B., McKee, C. F., & Tan, J. C. 2007a, in Protostars and Planets V, eds. B. Reipurth, D. Jewitt, & K. Keil, 165 [Google Scholar]
- Beuther, H., Zhang, Q., Bergin, E. A., et al. 2007b, A&A, 468, 1045 [NASA ADS] [CrossRef] [EDP Sciences] [Google Scholar]
- Beuther, H., Linz, H., & Henning, T. 2012a, A&A, 543, A88 [NASA ADS] [CrossRef] [EDP Sciences] [Google Scholar]
- Beuther, H., Tackenberg, J., Linz, H., et al. 2012b, ApJ, 747, 43 [NASA ADS] [CrossRef] [Google Scholar]
- Bontemps, S., Motte, F., Csengeri, T., & Schneider, N. 2010, A&A, 524, A18 [NASA ADS] [CrossRef] [EDP Sciences] [Google Scholar]
- Campbell, B. 1984, ApJ, 282, L27 [NASA ADS] [CrossRef] [Google Scholar]
- Campbell, B., & Thompson, R. I. 1984, ApJ, 279, 650 [NASA ADS] [CrossRef] [Google Scholar]
- Cesaroni, R., Neri, R., Olmi, L., et al. 2005, A&A, 434, 1039 [NASA ADS] [CrossRef] [EDP Sciences] [Google Scholar]
- Cesaroni, R., Galli, D., Lodato, G., Walmsley, C. M., & Zhang, Q. 2007, in Protostars and Planets V, eds. B. Reipurth, D. Jewitt, & K. Keil, 197 [Google Scholar]
- Commerçon, B., Hennebelle, P., & Henning, T. 2011, ApJ, 742, L9 [NASA ADS] [CrossRef] [Google Scholar]
- Davis, C. J., Moriarty-Schieven, G., Eislöffel, J., Hoare, M. G., & Ray, T. P. 1998, AJ, 115, 1118 [NASA ADS] [CrossRef] [Google Scholar]
- De Buizer, J. M., & Minier, V. 2005, ApJ, 628, L151 [NASA ADS] [CrossRef] [Google Scholar]
- De Buizer, J. M., Radomski, J. T., Telesco, C. M., & Piña, R. K. 2005, ApJS, 156, 179 [NASA ADS] [CrossRef] [Google Scholar]
- Draine, B. T., Dale, D. A., Bendo, G., et al. 2007, ApJ, 663, 866 [NASA ADS] [CrossRef] [Google Scholar]
- Fallscheer, C., Beuther, H., Zhang, Q., Keto, E., & Sridharan, T. K. 2009, A&A, 504, 127 [NASA ADS] [CrossRef] [EDP Sciences] [Google Scholar]
- Gaume, R. A., Goss, W. M., Dickel, H. R., Wilson, T. L., & Johnston, K. J. 1995, ApJ, 438, 776 [NASA ADS] [CrossRef] [Google Scholar]
- Gerner, et al. 2013, A&A, submitted [Google Scholar]
- Hildebrand, R. H. 1983, QJRAS, 24, 267 [NASA ADS] [Google Scholar]
- Hoffman, I. M., Goss, W. M., Palmer, P., & Richards, A. M. S. 2003, ApJ, 598, 1061 [NASA ADS] [CrossRef] [Google Scholar]
- Hofner, P., Wiesemeyer, H., & Henning, T. 2001, ApJ, 549, 425 [NASA ADS] [CrossRef] [Google Scholar]
- Ilee, J. D., Wheelwright, H. E., Oudmaijer, R. D., et al. 2013, MNRAS, 429, 2960 [NASA ADS] [CrossRef] [Google Scholar]
- Jenkins, E. B. 2004, in Origin and Evolution of the Elements, eds. A. McWilliam, & M. Rauch, 336 [Google Scholar]
- Keto, E. R. 1991, ApJ, 371, 163 [NASA ADS] [CrossRef] [Google Scholar]
- Knez, C., Lacy, J. H., Evans, II, N. J., van Dishoeck, E. F., & Richter, M. J. 2009, ApJ, 696, 471 [NASA ADS] [CrossRef] [Google Scholar]
- Kraus, S., Balega, Y., Elitzur, M., et al. 2006, A&A, 455, 521 [NASA ADS] [CrossRef] [EDP Sciences] [Google Scholar]
- Krumholz, M. R., Klein, R. I., & McKee, C. F. 2007a, ApJ, 665, 478 [NASA ADS] [CrossRef] [Google Scholar]
- Krumholz, M. R., Klein, R. I., & McKee, C. F. 2007b, ApJ, 656, 959 [NASA ADS] [CrossRef] [Google Scholar]
- Krumholz, M. R., Klein, R. I., McKee, C. F., Offner, S. S. R., & Cunningham, A. J. 2009, Science, 323, 754 [NASA ADS] [CrossRef] [PubMed] [Google Scholar]
- Kuiper, R., Klahr, H., Beuther, H., & Henning, T. 2011, ApJ, 732, 20 [NASA ADS] [CrossRef] [Google Scholar]
- Kuiper, R., Klahr, H., Beuther, H., & Henning, T. 2012, A&A, 537, A122 [NASA ADS] [CrossRef] [EDP Sciences] [Google Scholar]
- Linz, H., Stecklum, B., Henning, T., Hofner, P., & Brandl, B. 2005, A&A, 429, 903 [NASA ADS] [CrossRef] [EDP Sciences] [Google Scholar]
- Linz, H., Henning, T., Feldt, M., et al. 2009, A&A, 505, 655 [NASA ADS] [CrossRef] [EDP Sciences] [Google Scholar]
- Mathis, J. S., Rumpl, W., & Nordsieck, K. H. 1977, ApJ, 217, 425 [NASA ADS] [CrossRef] [Google Scholar]
- Maury, A. J., André, P., Hennebelle, P., et al. 2010, A&A, 512, A40 [NASA ADS] [CrossRef] [EDP Sciences] [Google Scholar]
- McKee, C. F., & Ostriker, E. C. 2007, ARA&A, 45, 565 [NASA ADS] [CrossRef] [Google Scholar]
- McKee, C. F., & Tan, J. C. 2003, ApJ, 585, 850 [NASA ADS] [CrossRef] [MathSciNet] [Google Scholar]
- Minier, V., Booth, R. S., & Conway, J. E. 2000, A&A, 362, 1093 [NASA ADS] [Google Scholar]
- Minier, V., Conway, J. E., & Booth, R. S. 2001, A&A, 369, 278 [NASA ADS] [CrossRef] [EDP Sciences] [Google Scholar]
- Moscadelli, L., Reid, M. J., Menten, K. M., et al. 2009, ApJ, 693, 406 [NASA ADS] [CrossRef] [Google Scholar]
- Ossenkopf, V., & Henning, T. 1994, A&A, 291, 943 [NASA ADS] [Google Scholar]
- Pestalozzi, M. R., Elitzur, M., Conway, J. E., & Booth, R. S. 2004, ApJ, 603, L113 [NASA ADS] [CrossRef] [Google Scholar]
- Pestalozzi, M. R., Elitzur, M., & Conway, J. E. 2009, A&A, 501, 999 [NASA ADS] [CrossRef] [EDP Sciences] [Google Scholar]
- Peters, T., Klessen, R. S., Mac Low, M.-M., & Banerjee, R. 2010, ApJ, 725, 134 [NASA ADS] [CrossRef] [Google Scholar]
- Puga, E., Marín-Franch, A., Najarro, F., et al. 2010, A&A, 517, A2 [NASA ADS] [CrossRef] [EDP Sciences] [Google Scholar]
- Qiu, K., Zhang, Q., & Menten, K. M. 2011, ApJ, 728, 6 [NASA ADS] [CrossRef] [Google Scholar]
- Reid, M. A., & Wilson, C. D. 2005, ApJ, 625, 891 [NASA ADS] [CrossRef] [Google Scholar]
- Sandell, G., & Sievers, A. 2004, ApJ, 600, 269 [NASA ADS] [CrossRef] [Google Scholar]
- Sandell, G., & Wright, M. 2010, ApJ, 715, 919 [NASA ADS] [CrossRef] [Google Scholar]
- Sandell, G., Goss, W. M., Wright, M., & Corder, S. 2009, ApJ, 699, L31 [NASA ADS] [CrossRef] [Google Scholar]
- Schreyer, K., Henning, T., van der Tak, F. F. S., Boonman, A. M. S., & van Dishoeck, E. F. 2002, A&A, 394, 561 [NASA ADS] [CrossRef] [EDP Sciences] [Google Scholar]
- Simon, M., Dutrey, A., & Guilloteau, S. 2000, ApJ, 545, 1034 [NASA ADS] [CrossRef] [Google Scholar]
- Stahler, S. W., & Palla, F. 2005, The Formation of Stars (Wiley-VCH) [Google Scholar]
- Thi, W.-F., & Bik, A. 2005, A&A, 438, 557 [NASA ADS] [CrossRef] [EDP Sciences] [Google Scholar]
- Vaidya, B., Fendt, C., & Beuther, H. 2009, ApJ, 702, 567 [NASA ADS] [CrossRef] [Google Scholar]
- van der Tak, F. F. S., van Dishoeck, E. F., & Caselli, P. 2000, A&A, 361, 327 [NASA ADS] [Google Scholar]
- Wheelwright, H. E., Oudmaijer, R. D., de Wit, W. J., et al. 2010, MNRAS, 408, 1840 [NASA ADS] [CrossRef] [Google Scholar]
- Willner, S. P. 1976, ApJ, 206, 728 [NASA ADS] [CrossRef] [Google Scholar]
- Wolfire, M. G., & Cassinelli, J. P. 1987, ApJ, 319, 850 [NASA ADS] [CrossRef] [Google Scholar]
- Zhang, Q., Hunter, T. R., Brand, J., et al. 2005, ApJ, 625, 864 [NASA ADS] [CrossRef] [Google Scholar]
- Zinnecker, H., & Yorke, H. W. 2007, ARA&A, 45, 481 [NASA ADS] [CrossRef] [Google Scholar]
All Tables
All Figures
|
Fig. 1 PdBI 843 μm continuum image toward NGC 7538 IRS1. The full line contour levels start at 3σ values and continue in 1σ steps of 50 mJy beam-1 (black contours from 3 to 9σ, white contours from 10 to 14σ). The dashed contour shows the same negative levels. The thick full line presents the 4σ contour (1σ ~ 29 mJy beam-1) from the 1.36 mm data presented in Beuther et al. (2012a). Several potential disk and outflow axes reported in the literature are presented (Davis et al. 1998; De Buizer & Minier 2005; Sandell et al. 2009; Pestalozzi et al. 2004, 2009; Sandell & Wright 2010, see Introduction for more details). The thick line presents the axis along which the position-velocity diagrams in Fig. 4 are conducted. The northern and northwestern peaks submmN and submmNW are labeled, and the open star, the six-pointed star, and the white triangles mark the positions of the OH, H2CO, and additional CH3OH masers (Argon et al. 2000; Hoffman et al. 2003; Minier et al. 2001). A scale-bar and the synthesized beam (0.2″ × 0.17″) are shown as well. The 0/0 position is the phase reference center in Sect. 2. |
| In the text | |
|
Fig. 2 Color scales in the left panels present the 0th moment (bottom, integrated intensity) and 1st moment (top, intensity weighted velocity) maps of the HCN(4–3)v2 = 1 emission. In the middle and right panels, the color-scale shows the 0th and 1st moment maps (bottom and top, respectively) of CH3OH(151,14−150,15). Black contours in all panels outline the dust continuum emission (Fig. 1) starting at the 3σ level and continuing in 2σ steps. The blue and red contours in the right panel show the blue- and red-shifted HCO+(4−3) emission integrated over the velocity regimes written above the panel. Contouring is done from 10 to 90% of the respective peak emission. The white triangles present the additional maser positions by Minier et al. (2000), and a beam and scale bar are presented as well. The CH3OH 1st moment map also marks the axis along which the position-velocity cuts in Fig. 4 are conducted. |
| In the text | |
|
Fig. 3 Top three continuum-subtracted spectra are extracted for HCN, CH3OH and HCO+ toward the central peak position (offset 0.1″/−0.2″). Bottom spectrum: the HCO+ spectra from the blue- and red-shifted outflow peak positions presented in Fig. 2 (offsets positions 0.33″/0.18″ and −0.18″/−0.48″, respectively). |
| In the text | |
|
Fig. 4 Position-velocity diagrams for HCN(4–3)v2 = 1 (left) CH3OH(151,14−150,15) (right) along the northeast-southwest, mid-infrared and molecular axis shown in Fig. 1. The full and dashed lines mark the rotation curves for embedded 30 and 8 M⊙ objects, respectively. The vlsr is shown as well. |
| In the text | |
Current usage metrics show cumulative count of Article Views (full-text article views including HTML views, PDF and ePub downloads, according to the available data) and Abstracts Views on Vision4Press platform.
Data correspond to usage on the plateform after 2015. The current usage metrics is available 48-96 hours after online publication and is updated daily on week days.
Initial download of the metrics may take a while.