Fig. 6
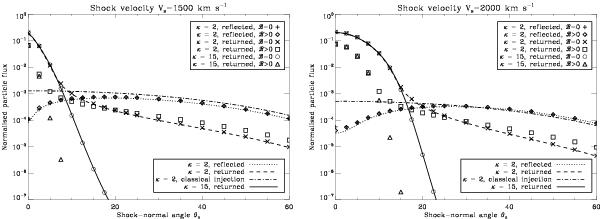
Particle fluxes at the shock: curves represent numerical integration results, data points are results of Monte Carlo simulations. Vs = 1500 km s-1 (left) and Vs = 2000 km s-1 (right). Simulations without downstream propagation of particles are designated with ℬ = 0, whereas simulations where particles isotropise through downstream scatterings are designated with ℬ > 0. The flux differences for the reflected particles in the Monte Carlo simulations (⋄ , +) are due to statistical uncertainties. For comparison, we show the integrated flux of all particles that are faster than the classical injection threshold v > u1 as a dash-dotted line. For κ = 15, reflected particle fluxes and the classical comparison are too low to be visible.
Current usage metrics show cumulative count of Article Views (full-text article views including HTML views, PDF and ePub downloads, according to the available data) and Abstracts Views on Vision4Press platform.
Data correspond to usage on the plateform after 2015. The current usage metrics is available 48-96 hours after online publication and is updated daily on week days.
Initial download of the metrics may take a while.