Fig. 5
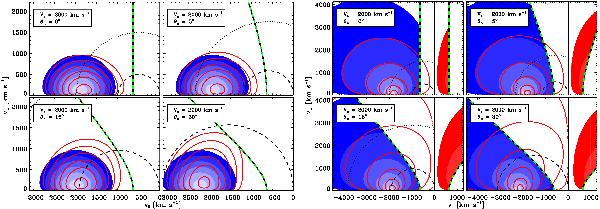
Visualised transfer of quasi-thermal (left, κ = 15) and non-thermal (right, κ = 2) particle flux densities dℱ/(dv∥ dv⊥) across a shock of velocity Vs = 2000 km s-1 with four different shock-normal angles. Blue contours depict the incident transmitting flux, red contours depict the reflected flux, and red solid contours the transmitted downstream flux at one magnitude intensity intervals. The black semicircles depict downstream speed thresholds for statistical return probabilities of 0% (dashed) and 25% (dotted), and the black-green dashed curve represents the reflection threshold.
Current usage metrics show cumulative count of Article Views (full-text article views including HTML views, PDF and ePub downloads, according to the available data) and Abstracts Views on Vision4Press platform.
Data correspond to usage on the plateform after 2015. The current usage metrics is available 48-96 hours after online publication and is updated daily on week days.
Initial download of the metrics may take a while.