| Issue |
A&A
Volume 557, September 2013
|
|
|---|---|---|
| Article Number | A48 | |
| Number of page(s) | 13 | |
| Section | Astrophysical processes | |
| DOI | https://doi.org/10.1051/0004-6361/201321874 | |
| Published online | 28 August 2013 | |
Spontaneously quenched γ-ray spectra from compact sources
Department of PhysicsUniversity of Athens,
Panepistimiopolis, 15783
Zografos,
Greece
e-mail: This email address is being protected from spambots. You need JavaScript enabled to view it.
Received:
10
May
2013
Accepted:
5
July
2013
Abstract
Aims. We have studied a mechanism for producing intrinsic broken power-law γ-ray spectra in compact sources. This is based on the principles of automatic photon quenching, according to which γ-rays are being absorbed on spontaneously produced soft photons whenever the injected luminosity in γ-rays lies above a certain critical value.
Methods. We derived an analytical expression for the critical γ-ray compactness in the case of power-law injection. For the case where automatic photon quenching is relevant, we calculated analytically the emergent steady-state γ-ray spectra. We also performed numerical calculations in order to back up our analytical results.
Results. We show that a spontaneously quenched power-law γ-ray spectrum obtains a photon index 3Γ/2, where Γ is the photon index of the power-law at injection. Thus, large spectral breaks of the γ-ray photon spectrum, e.g. ΔΓ ≳ 1, can be obtained by this mechanism. We also discuss additional features of this mechanism that can be tested observationally. Finally, we fit the multiwavelength spectrum of a newly discovered blazar (PKS 0447-439) by using such parameters to explain the break in the γ-ray spectrum by means of spontaneous photon quenching, under the assumption that its redshift lies in the range 0.1 < z < 0.24.
Key words: radiation mechanisms: non-thermal / gamma rays: general / BL Lacertae objects: general
© ESO, 2013
1. Introduction
The production and radiation transfer of high-energy γ-rays is a physical problem that has received a lot of attention over the last forty years since it can be applied on compact high-energy emitting astrophysical sources, such as active galactic nuclei (AGN) and gamma-ray bursts. Photon-photon absorption, in particular, turns out to be a significant physical process in compact X-ray and γ-ray emitting sources that results in electromagnetic (EM) cascades (e.g. Jelley 1966; Herterich 1974). The effects of EM cascades can be studied within either a linear or non-linear framework. In the first approach (e.g. Protheroe 1986), the number density of target photons is assumed to be fixed, whereas in the second, the produced electron/positron pairs produce photons, which in their turn serve as targets for photon-photon absorption (Kazanas 1984; Zdziarski & Lightman 1985; Svensson 1987). The first analytical studies of EM cascades were then followed by numerical works, which aimed at computing time-dependent solutions to the kinetic equations of electrons and photons taking photon-photon annihilation into account (Coppi 1992; Mastichiadis & Kirk 1995; Stern et al. 1995; Böttcher & Chiang 2002). These algorithms are now commonly used in source modelling (Mastichiadis & Kirk 1997; Kataoka et al. 2000; Konopelko et al. 2003; Katarzyński et al. 2005).
Intrinsically non-linear effects in EM cascades initiated by photon-photon absorption, however, have only recently gained attention. First, Stawarz & Kirk (2007, hereafter SK07) studied the case where no soft (i.e. target) photons are present in a source. They investigated the necessary conditions under which γ-ray photons can cause runaway pair production and found that these conditions can be summarized only in a single quantity, the critical γ-ray compactness. This can be considered an upper limit of the γ-ray compactness that depends on parameters such as the magnetic field strength and the size of the source. If the injection compactness of very high energy (VHE) photons (≳0.1 TeV) is larger than the critical compactness, the following non-linear loop is self-sustained: γ-ray photons are absorbed on soft photons emitted by the produced pairs through synchrotron radiation.
The work of SK07 was then expanded by Petropoulou & Mastichiadis (2011, hereafter PM11) mainly by taking into account continuous energy losses of the produced pairs. The non-linear loop of processes called “automatic photon quenching” by SK07 can be the core of other more complex ones. In particular, Petropoulou & Mastichiadis (2012b) or PM12b from this point on, have attributed the production of VHE γ-rays to synchrotron emission from secondaries produced in charged pion decay, while pions were the result of photohadronic interactions between relativistic protons and soft photons. Petropoulou & Mastichiadis (2012b) have shown that the system of protons and photons resembles a prey-predator system whenever automatic photon quenching operates, and it shows interesting variability patterns, such as limit cycles1.
In the present work we continue the exploration of spontaneous photon quenching by studying the case of power-law γ-ray injection in the source and, in that sense, it can be considered a continuation of the aforementioned works. There were two main motivations to our present study: (i) γ-ray spectra emitted by a power-law distribution of relativistic particles through some radiation mechanism, e.g. synchrotron radiation and inverse compton scattering, can be modelled by a power-law, at least partially; and (ii) if spontaneous photon absorption affects part of the γ-ray injection spectrum, spectral breaks are produced; we believe that this requires further investigation as it is an intrinsic mechanism for producing breaks in a γ-ray spectrum and it could be of relevance to recent results regarding γ-ray emitting blazars.
The present paper is structured as follows: in Sect. 2 we derive an analytical expression for the critical γ-ray compactness in the case of power-law injection using certain simplifying assumptions, while we comment also on the validity range of our result. In the case where spontaneous photon quenching becomes relevant, we show that a break at the steady-state γ-ray spectrum appears and we also calculate analytically the expected spectral change. In Sect. 3 we derive numerically the critical compactness for a wide range of parameter values and examine the effects that a primary soft photon component in the source would have on γ-ray absorption. Possible implications of spontaneous absorption on γ-ray emitting blazars are presented in Sect. 4. We also present a list of observationally tested characteristics that a spontaneously quenched source would, in principle, show. In the same section we also show that the spectral energy distribution (SED) of the newly discovered blazar PKS 0477-439 can be explained within the framework of automatic quenching. For the required transformations between the reference systems of the blazar and the observer we have adopted a cosmology with Ωm = 0.3, ΩΛ = 0.7, and H0 = 70 km s-1 Mpc-1.
2. Analytical approach
We consider a spherical region of radius R containing a magnetic field of
strength B. We assume that γ-rays are being produced in
this volume by some non-thermal emission process, e.g. proton synchrotron radiation. In our
analysis however, the γ-ray production mechanism remains unspecified, since
its exact nature does not play a role in the derivation of our results. Furthermore,
γ-rays are being injected with a luminosity
 that is
related to the injected γ-ray compactness as
that is
related to the injected γ-ray compactness as  (1)where
σT is the Thomson cross section. Without any substantial soft
photon population inside the source, the γ-rays will escape without any
attenuation in one crossing time. However, as SK07 and PM11 showed, the injected
γ-ray compactness cannot become arbitrarily high because, if a critical
value is reached, the following loop starts operating: (i) gamma-rays pair-produce on soft
photons, which can be initially arbitrarily low inside the source; (ii) the produced
electron-positron pairs are highly relativistic since they are created with approximately
half the energy of the initial γ-ray photon, and cool mainly by synchrotron
radiation, thus acting as a source of soft photons; and (iii) the emitted synchrotron
photons have lower energy when compared to the γ-ray photons and serve as
targets for more γγ interactions.
(1)where
σT is the Thomson cross section. Without any substantial soft
photon population inside the source, the γ-rays will escape without any
attenuation in one crossing time. However, as SK07 and PM11 showed, the injected
γ-ray compactness cannot become arbitrarily high because, if a critical
value is reached, the following loop starts operating: (i) gamma-rays pair-produce on soft
photons, which can be initially arbitrarily low inside the source; (ii) the produced
electron-positron pairs are highly relativistic since they are created with approximately
half the energy of the initial γ-ray photon, and cool mainly by synchrotron
radiation, thus acting as a source of soft photons; and (iii) the emitted synchrotron
photons have lower energy when compared to the γ-ray photons and serve as
targets for more γγ interactions.
There are two conditions that should be satisfied simultaneously for this network to occur:
-
1.
Feedback criterion This is related to the energythreshold condition for photon-photon absorption and it requiresthat the synchrotron photons emitted from the pairs havesufficient energy to pair-produce on the γ-rays.
-
2.
Marginal stability criterion This is related to the optical depth for photon-photon absorption, which must be above unity in order to establish the growth of the instability.
By making suitable simplifying assumptions, one can derive an analytic relation for the
first condition (see also SK07). Thus, combining (i) the threshold condition for
γγ absorption ϵx = 2, where ϵ and
x are the γ-ray and soft photon energies in units of
mec2, respectively (this
normalization will be used for all photon energies throughout the text unless stated
otherwise); (ii) the fact that there is equipartition of energy among the created
electron-positron pairs
γe = γ = ϵ/2; and (iii) the
assumption that the required soft photons are the synchrotron photons that the
electrons/positrons radiate, i.e.
xs = bγ2, where
b = B/Bcrit and
 G, one finds the
relation
G, one finds the
relation  (2)that
defines, for a certain magnetic field strength, the γ-ray photon energy
above which automatic photon quenching becomes relevant.
(2)that
defines, for a certain magnetic field strength, the γ-ray photon energy
above which automatic photon quenching becomes relevant.
In what follows, we will concentrate on the second condition, since our aim is to determine the value of the injected γ-ray compactness that ensures the growth of the instability. The corresponding calculations in the case of monoenergetic γ-ray injection can be found in SK07 and PM11. Here we focus on the more astrophysically relevant case of a power-law γ-ray injection. To treat this problem analytically we discretize the power-law of γ-rays. In particular, we begin by calculating the critical compactness in the case where two monoenergetic γ-rays are injected. We repeat the calculation for the injection of three monoenergetic γ-rays and, finally, we generalize our result for N monoenergetic injection functions. Furthermore, our treatment is built upon the following assumptions and approximations:
-
1.
Only two physical processes are taken into account, i.e.photon-photon absorption and synchrotron radiation of theproduced pairs. Inverse Compton scattering of pairs on thesynchrotron produced photons can be safely neglected becauseof the strong magnetic field that is typically required for theautomatic photon quenching loop to function, and because of thelarge2Lorentz factors of the produced pairs.
-
2.
Only the equations describing the evolution of γ-rays and synchrotron (soft) photons are taken into account. The equation for the pairs is neglected, since these have synchrotron cooling timescales much smaller than the crossing time of the source. Thus, all the injected energy into pairs is transformed into synchrotron radiation.
-
3.
Synchrotron emissivity is approximated by a δ-function, i.e. js(x) = j0δ(x − xs), where xs = bγ2 is the synchrotron critical energy.
-
4.
The synchrotron energy losses of pairs are treated as catastrophic escape from the considered energy range. In other words, an electron with Lorentz factor γ loses its energy by radiating synchrotron photons at energy bϵ2/4.
-
5.
The cross section of photon-photon absorption (in units of σT) is approximated as
 (3)which
is the same as the cross section given by Coppi
& Blandford (1990) apart from the logarithmic term
ln(x).
(3)which
is the same as the cross section given by Coppi
& Blandford (1990) apart from the logarithmic term
ln(x).
2.1. Marginal stability criterion for injection of two monoenergetic γ-rays
If we assume that γ-rays are being injected into the source at energies
ϵ1 and ϵ2
(ϵ1 < ϵ2) with
compactnesses  ,
where i = 1,2, we can use suitable parameters to ensure that the
γ-ray photon with the minimum energy satisfies the feedback criterion,
i.e.
ϵ1 > ϵq = 2/b1/3.
Then, all higher energy γ-ray photons also satisfy the feedback criterion
and the corresponding emitted synchrotron photons have energies
,
where i = 1,2, we can use suitable parameters to ensure that the
γ-ray photon with the minimum energy satisfies the feedback criterion,
i.e.
ϵ1 > ϵq = 2/b1/3.
Then, all higher energy γ-ray photons also satisfy the feedback criterion
and the corresponding emitted synchrotron photons have energies
 .
Gamma-ray photons with energy ϵi can,
therefore, be absorbed on both soft photon distributions because the energy threshold
criterion is satisfied for all the four possible photon-photon interactions, i.e.
ϵixs,j > 2
for i,j = 1,2. We note also that we do not consider absorption of
γ-rays on less energetic γ-rays. Moreover, the number
densities of γ-ray photons and of the corresponding soft photons are
denoted as
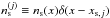
.
Gamma-ray photons with energy ϵi can,
therefore, be absorbed on both soft photon distributions because the energy threshold
criterion is satisfied for all the four possible photon-photon interactions, i.e.
ϵixs,j > 2
for i,j = 1,2. We note also that we do not consider absorption of
γ-rays on less energetic γ-rays. Moreover, the number
densities of γ-ray photons and of the corresponding soft photons are
denoted as  and
and  ,
respectively, where the symbols imply the relations
,
respectively, where the symbols imply the relations
 and
and
 ; the
densities refer to the number of photons contained in a volume element
σTR. In other words, if
; the
densities refer to the number of photons contained in a volume element
σTR. In other words, if
 expresses the number of photons per erg per cm3, then
 .
The dimensionless photon number densities are also related to the compactnesses through
the relation
.
The dimensionless photon number densities are also related to the compactnesses through
the relation 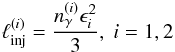 (4)for
discrete monoenergetic injection3. Using the
notations introduced above along with the assumptions 1–5 the system can be described by
four equations
(4)for
discrete monoenergetic injection3. Using the
notations introduced above along with the assumptions 1–5 the system can be described by
four equations 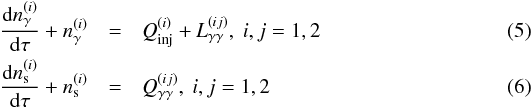 where
time is normalized with respect to the photon crossing/escape time from the source, i.e.
τ = ct/R, and the operators
L and Q denote losses and injection respectively; the
loss term in Eq. (6) due to photon-photon
absorption is omitted since it is negligible. We note that number densities and rates are
equivalent in the dimensionless form of the above equations. The explicit expressions of
the operators in Eqs. (5) and (6) are
where
time is normalized with respect to the photon crossing/escape time from the source, i.e.
τ = ct/R, and the operators
L and Q denote losses and injection respectively; the
loss term in Eq. (6) due to photon-photon
absorption is omitted since it is negligible. We note that number densities and rates are
equivalent in the dimensionless form of the above equations. The explicit expressions of
the operators in Eqs. (5) and (6) are 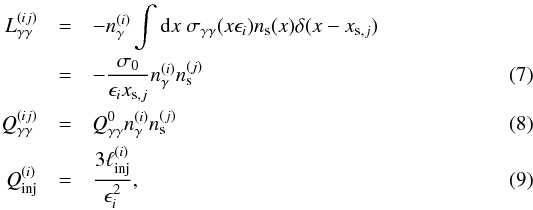 where
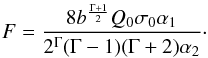
the normalization constant
where
the normalization constant  is
calculated by equating the total γ-ray energy loss rate with the total
energy injection rate into soft photons, i.e.
− ∫dϵ ϵLγγ = ∫dx xQγγ,
and it is given by
is
calculated by equating the total γ-ray energy loss rate with the total
energy injection rate into soft photons, i.e.
− ∫dϵ ϵLγγ = ∫dx xQγγ,
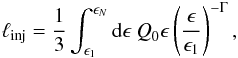
and it is given by  (10)We
also note that in the case of continuous power-law injection, Eq. (9) should be replaced by
Qinj(ϵ) = 3ℓinj(ϵ)/ϵ.
The trivial stationary solution of Eqs. (5)
and (6) is
(10)We
also note that in the case of continuous power-law injection, Eq. (9) should be replaced by
Qinj(ϵ) = 3ℓinj(ϵ)/ϵ.
The trivial stationary solution of Eqs. (5)
and (6) is
 , where
 and it
corresponds to the case where the injection rate of γ-rays equals the
photon escape rate from the source. Following the methodology described in SK07 and PM11,
we introduce perturbations to all photon number densities and linearize the set of Eqs.
(5) and (6) around the trivial solution. The linearized system can be written in
the form dY/dτ = AY where
and it
corresponds to the case where the injection rate of γ-rays equals the
photon escape rate from the source. Following the methodology described in SK07 and PM11,
we introduce perturbations to all photon number densities and linearize the set of Eqs.
(5) and (6) around the trivial solution. The linearized system can be written in
the form dY/dτ = AY where
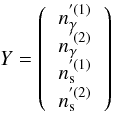 (11)is
the vector of the perturbed number densities and A is the matrix of the
linearized system of equations
(11)is
the vector of the perturbed number densities and A is the matrix of the
linearized system of equations 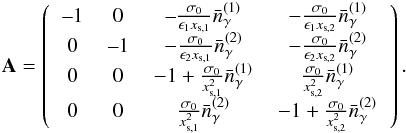 (12)In
order to build a finite number of soft photons in the source, the perturbations must grow
with time. This is ensured if at least one of the eigenvalues of matrix A is
positive. After some algebraic manipulation we find that, indeed, one eigenvalue can
become positive if the following condition holds:
(12)In
order to build a finite number of soft photons in the source, the perturbations must grow
with time. This is ensured if at least one of the eigenvalues of matrix A is
positive. After some algebraic manipulation we find that, indeed, one eigenvalue can
become positive if the following condition holds: 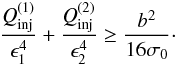 (13)The
same methodology can be applied in the case where γ-rays are being
injected as a δ- function at three energies
ϵ1 < ϵ2 < ϵ3.
This leads to an analogous critical condition
(13)The
same methodology can be applied in the case where γ-rays are being
injected as a δ- function at three energies
ϵ1 < ϵ2 < ϵ3.
This leads to an analogous critical condition 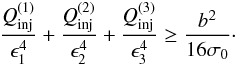 (14)
(14)
2.2. Critical compactness for power-law γ-ray injection
The above can be generalized for the case of N monoenergetic
γ-rays with energies
ϵ1 < ϵi < ϵN
to find the marginal stability criterion 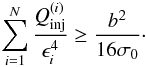 (15)We
have verified that the above relation also applies to cases where the feedback criterion
is not satisfied for γ-rays of the minimum energy but for higher energy
photons, i.e.
ϵk = 2/b1/3
with k > 1, with only a slight modification: the summation starts
from i = k. Moreover, if we assume that the injection
rate of γ-ray photons can be modelled as a power-law, e.g.
(15)We
have verified that the above relation also applies to cases where the feedback criterion
is not satisfied for γ-rays of the minimum energy but for higher energy
photons, i.e.
ϵk = 2/b1/3
with k > 1, with only a slight modification: the summation starts
from i = k. Moreover, if we assume that the injection
rate of γ-ray photons can be modelled as a power-law, e.g.
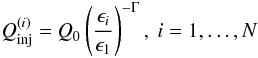 (16)the
criterion of Eq. (15) takes the form
(16)the
criterion of Eq. (15) takes the form
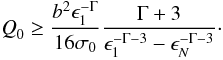
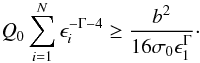 (17)If
N → ∞ and
(ϵi + 1−ϵi) → 0,
the discrete sum of Eq. (17) can be
trasformed into an integral which leads to
(17)If
N → ∞ and
(ϵi + 1−ϵi) → 0,
the discrete sum of Eq. (17) can be
trasformed into an integral which leads to
 (18)Finally,
if we replace the normalization constant Q0 by the integrated
γ-ray compactness over all photon energies (see also comment on Eq.
(9)) using
(18)Finally,
if we replace the normalization constant Q0 by the integrated
γ-ray compactness over all photon energies (see also comment on Eq.
(9)) using
 (19)we
find that
ℓinj ≥ ℓγ,cr
where ℓγ,cr is the critical compactness for a
power-law γ-ray injection. This has a compact form
(19)we
find that
ℓinj ≥ ℓγ,cr
where ℓγ,cr is the critical compactness for a
power-law γ-ray injection. This has a compact form 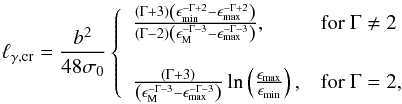 (20)where
ϵmin ≡ ϵ1,
ϵmax ≡ ϵN, and
ϵM = max [ ϵmin,ϵq ]
(see Eq. (2) for the definition of
ϵq).
(20)where
ϵmin ≡ ϵ1,
ϵmax ≡ ϵN, and
ϵM = max [ ϵmin,ϵq ]
(see Eq. (2) for the definition of
ϵq).
We were able to derive an analytical and rather simple expression of the critical compactness in the case of power-law injection at the cost, however, of a series of approximations/assumptions that may limit the validity range of our result. It is reasonable therefore, before closing the present section to check the range of validity of Eq. (20). For this, we made a comparison between this expression and the numerically derived values4, which is illustrated in Fig. 1. Both panels show the dependence of ℓγ,cr on ϵmin for two different pairs of photon indices marked on the plots. Lines and symbols are used for plotting the analytically and numerically derived values respectively, while different types of lines/symbols correspond to different values of the photon index. For values of ϵmin below ϵq, which for the values used in this example equals 2 × 10⁴, we find a good agreement between our analytical and numerical results, apart from a numerical factor of ≃2; we note that the dependence of ℓγ,cr given by Eq. (20) on ϵmin coincides with the numerically determined dependence. However, the analytical solution of ℓγ,cr fails in the energy range of ϵmin ≥ ϵq, since in this regime the approximation 4 listed at the beginning of Sect. 2 proves to be crude.
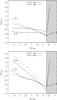 |
Fig. 1 Top panel: critical compactness ℓγ,cr as a function of the minimum energy of the γ-ray spectrum ϵmin for Γ = 1.6 (solid line) and Γ = 2 (dashed line). The numerically derived values for the two cases are shown with circles and triangles, respectively. Bottom panel: same as in top panel except for different photon indices, which are marked on the plot. Other parameters used are: ϵmax = 2.3 × 10⁵ (in mec2 units), B = 40 G, and R = 3 × 1016 cm. In both panels the grey area denotes the region where ϵmin > ϵq; see text for the definition of ϵq. |
2.3. Steady state γ-ray quenched spectrum
Assuming that the injected γ-ray compactness exceeds the critical value
derived in the previous section, we search for steady-state solutions of the system. There
is a main difference between the analytical approach that we follow in this section and
the one presented in Sect. 2.1: here we take into account the cooling of pairs due to
synchrotron radiation, i.e. synchrotron losses are treated as a continuous energy loss
mechanism. For this reason, in addition to the equations of γ-rays and
soft photons, we include in our analysis a third equation for electron/positron pairs or
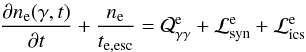
simply electrons from this point on. Dropping the time derivatives, the kinetic equations
for γ-rays, soft photons, and electrons are written respectively as
 and
and
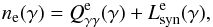 (23)where
ne is the dimensionless electron number density, and an
electron escape timescale
te,esc = tcr was assumed. All
normalizations and approximations, apart from the fourth in our list, are the same as in
Sect. 2.1. The synchrotron emissivity is approximated by a δ-function
(see Sect. 2.1). We note that in what follows we can safely neglect electron escape from
the source since for magnetic field strengths relevant to automatic quenching, synchrotron
cooling is the dominant term in the electron equation; thus, the left-hand side of Eq.
(23) is essentially equal to zero. Then,
the injection and loss operators take the forms
(23)where
ne is the dimensionless electron number density, and an
electron escape timescale
te,esc = tcr was assumed. All
normalizations and approximations, apart from the fourth in our list, are the same as in
Sect. 2.1. The synchrotron emissivity is approximated by a δ-function
(see Sect. 2.1). We note that in what follows we can safely neglect electron escape from
the source since for magnetic field strengths relevant to automatic quenching, synchrotron
cooling is the dominant term in the electron equation; thus, the left-hand side of Eq.
(23) is essentially equal to zero. Then,
the injection and loss operators take the forms 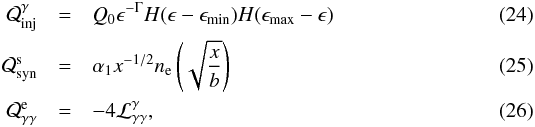 where
the form of
where
the form of  implies the use of
a δ-function for the synchrotron emissivity (see e.g. Mastichiadis & Kirk 1995) and
α1 = (2/3)ℓBb− 3/2.
The loss operators are given by
implies the use of
a δ-function for the synchrotron emissivity (see e.g. Mastichiadis & Kirk 1995) and
α1 = (2/3)ℓBb− 3/2.
The loss operators are given by 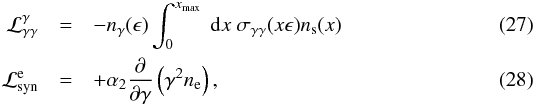 where
where
 is the maximum energy of the
produced soft photon distribution5,
α2 = 4ℓB/3 with
ℓB = σTRUB/mec2
being the magnetic compactness, and σγγ is
the dimensionless (in units of σT) cross section for
photon-photon absorption (see point (5) of Sect. 2). Within this approximation Eq. (27) takes the form
is the maximum energy of the
produced soft photon distribution5,
α2 = 4ℓB/3 with
ℓB = σTRUB/mec2
being the magnetic compactness, and σγγ is
the dimensionless (in units of σT) cross section for
photon-photon absorption (see point (5) of Sect. 2). Within this approximation Eq. (27) takes the form 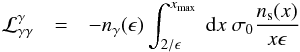 (29)which
further implies that γ-rays with energy
ϵ < ϵbr ≡ 2/xmax
cannot be absorbed. Thus, pairs with
γ < γbr ≡ ϵbr/2
cannot be produced, i.e. the injection term in Eq. (23) vanishes. The above can be summarized by inserting the step
function H(ϵ − ϵbr) in the
expression of
(29)which
further implies that γ-rays with energy
ϵ < ϵbr ≡ 2/xmax
cannot be absorbed. Thus, pairs with
γ < γbr ≡ ϵbr/2
cannot be produced, i.e. the injection term in Eq. (23) vanishes. The above can be summarized by inserting the step
function H(ϵ − ϵbr) in the
expression of  given by
Eq. (29). On the one hand, for
γ < γbr the electron distribution
has the trivial form ne ∝ γ-2. On
the other hand, for γ ≥ γbr, the distribution
is determined by synchrotron losses and pair injection.
given by
Eq. (29). On the one hand, for
γ < γbr the electron distribution
has the trivial form ne ∝ γ-2. On
the other hand, for γ ≥ γbr, the distribution
is determined by synchrotron losses and pair injection.
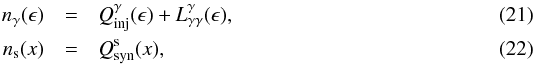
We now proceed to calculate the electron distribution for
γ > γbr. After having inserted the
above expressions for the operators into Eqs. (21)–(23), we combine them into
one non-linear integrodifferential equation, where the unknown function is
ne(γ): 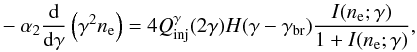 (30)where
 (31)Integration
of Eq. (30) leads to
(31)Integration
of Eq. (30) leads to ![Mathematical equation: \begin{eqnarray} \alpha_2\left[\gamma'^2\nel(\gamma')\right]_{\gmx}^{\gamma}=\frac{Q_0}{2^{\Gamma-2}}\int_{\gamma_{\rm min}^{\rm eff}}^{\gmx} \!\! \textrm{d}\gamma' \ \gamma'^{-\Gamma}\frac{I(\nel;\gamma')} {1+I(\nel;\gamma')}, \label{integral} \end{eqnarray}](/articles/aa/full_html/2013/09/aa21874-13/aa21874-13-eq125.png) (32)where
we have used the notation
(32)where
we have used the notation ![Mathematical equation: \hbox{$\left[Y\right]_{x_1}^{x_2}\equiv Y(x_2)-Y(x_1)$}](/articles/aa/full_html/2013/09/aa21874-13/aa21874-13-eq126.png) and
and
![Mathematical equation: \hbox{$\gamma_{\rm min}^{\rm eff}=\textrm{max}[\gamma,\gmn,\gcr]$}](/articles/aa/full_html/2013/09/aa21874-13/aa21874-13-eq127.png) . If
γbr > γmin then
. If
γbr > γmin then
 ,
whereas if γbr < γmin then
,
whereas if γbr < γmin then
 can be
equal either to γmin or γ. The condition
γbr < γmin corresponds to
the physical case where the entire γ-ray power-law spectrum is affected
by automatic quenching. Therefore, the steady-state γ-ray spectrum will
show, in general, no break (see also numerical example in Fig. 8 of PM11). Since in the
present work we are interested in producing broken power-law γ-ray
spectra, we will examine only the case where
γbr > γmin and therefore
. Since
an exact solution of Eq. (32) cannot be
obtained analytically, we assume a certain form for the solution we are searching for. A
reasonable guess is that the electron distribution is a power-law, i.e.
ne = N0γ− p,
where N0 and p are the parameters to be
defined. Inserting this function into Eq. (32) we obtain
can be
equal either to γmin or γ. The condition
γbr < γmin corresponds to
the physical case where the entire γ-ray power-law spectrum is affected
by automatic quenching. Therefore, the steady-state γ-ray spectrum will
show, in general, no break (see also numerical example in Fig. 8 of PM11). Since in the
present work we are interested in producing broken power-law γ-ray
spectra, we will examine only the case where
γbr > γmin and therefore
. Since
an exact solution of Eq. (32) cannot be
obtained analytically, we assume a certain form for the solution we are searching for. A
reasonable guess is that the electron distribution is a power-law, i.e.
ne = N0γ− p,
where N0 and p are the parameters to be
defined. Inserting this function into Eq. (32) we obtain ![Mathematical equation: \begin{eqnarray} \alpha_2 N_0\left[\gamma'^{-p+2}\right]_{\gmx}^{\gamma} = \frac{Q_0}{2^{\Gamma-2}}\int_{\gamma}^{\gmx}\!\!\textrm{d}\gamma' \frac{A(N_0,p) \gamma'^{-\Gamma+\beta}}{1+A(N_0,p)\gamma'^{\beta}}, \label{equation1} \end{eqnarray}](/articles/aa/full_html/2013/09/aa21874-13/aa21874-13-eq136.png) (33)where
(33)where
 and
A(N0,p) = N0bp/2α1σ0/(p + 1)
is a function only of the unknown parameters for fixed values of the magnetic field and
source size. We also note that we have neglected the contribution of terms calculated at
the upper limit (xmax) while performing the integral
I(γ′), so that the solution of the final integral
appearing at the right-hand side of Eq. (33) can be expressed in closed form as
and
A(N0,p) = N0bp/2α1σ0/(p + 1)
is a function only of the unknown parameters for fixed values of the magnetic field and
source size. We also note that we have neglected the contribution of terms calculated at
the upper limit (xmax) while performing the integral
I(γ′), so that the solution of the final integral
appearing at the right-hand side of Eq. (33) can be expressed in closed form as ![Mathematical equation: \begin{eqnarray} \left[\frac{A\gamma'^{-\Gamma+\beta+1}}{-\Gamma+\beta+1} {_2F_{1}}\left(1,1+\frac{1-\Gamma}{\beta},2+\frac{1-\Gamma}{\beta};-A\gamma'^{\beta}\right)\right]_{\gamma}^{\gmx}\!\!\!\!, \label{hypergeometric} \end{eqnarray}](/articles/aa/full_html/2013/09/aa21874-13/aa21874-13-eq141.png) (34)where
2F1(a,b,c;z) is the Gauss
hypergeometric function. Without making any further approximations, the above equation
cannot be solved for p and N0 analytically.
However, if the term Aγ′β
inside the integral is much larger than unity, this is, then, greatly simplified and Eq.
(33) takes the form
(34)where
2F1(a,b,c;z) is the Gauss
hypergeometric function. Without making any further approximations, the above equation
cannot be solved for p and N0 analytically.
However, if the term Aγ′β
inside the integral is much larger than unity, this is, then, greatly simplified and Eq.
(33) takes the form ![Mathematical equation: \begin{eqnarray} -\alpha_2 N_0\left[\gamma'^{-p+2}\right]_{\gamma}^{\gmx} \approx \frac{Q_02^{-\Gamma+2}}{-\Gamma+1} \left[\gamma'^{-\Gamma+1}\right]_{\gamma}^{\gmx}, \label{equation2} \end{eqnarray}](/articles/aa/full_html/2013/09/aa21874-13/aa21874-13-eq144.png) (35)which
is satisfied for
(35)which
is satisfied for 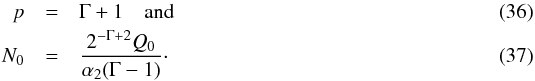 The
above solution is valid as long as Γ ≠ 1. In the opposite case, one should search for more
general forms of the electron distribution, i.e.
ne(γ) ∝ N0(γ)γ− p,
and follow the same procedure. However, for the purposes of the present work, the solution
for Γ ≠ 1 is sufficient. Summarizing, the electron distribution is given by
The
above solution is valid as long as Γ ≠ 1. In the opposite case, one should search for more
general forms of the electron distribution, i.e.
ne(γ) ∝ N0(γ)γ− p,
and follow the same procedure. However, for the purposes of the present work, the solution
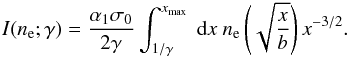
for Γ ≠ 1 is sufficient. Summarizing, the electron distribution is given by 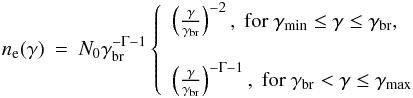 (38)where
we have demanded the solution to be continuous at
γ = γbr. We note that the slope of the
electron distribution above γbr is Γ + 1, i.e. steeper than
that at injection (see term γ′−Γ in Eq. (32)) by one. This denotes the efficient
synchrotron cooling of the whole distribution. We emphasize that the results for
γ ≳ γbr should be taken cautiously into
consideration, since the above solution is not valid for all γ above
γbr; we note that it was derived under the approximation
Aγβ > 1 or
equivalently
(38)where
we have demanded the solution to be continuous at
γ = γbr. We note that the slope of the
electron distribution above γbr is Γ + 1, i.e. steeper than
that at injection (see term γ′−Γ in Eq. (32)) by one. This denotes the efficient
synchrotron cooling of the whole distribution. We emphasize that the results for
γ ≳ γbr should be taken cautiously into
consideration, since the above solution is not valid for all γ above
γbr; we note that it was derived under the approximation
Aγβ > 1 or
equivalently 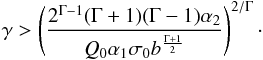 (39)After
having determined the form of the electron distribution we can then calculate the
steady-state solutions for γ-rays and soft photons. For
ϵ ≤ ϵbr the injected spectrum remains
unaffected by automatic quenching, whereas for
ϵ > ϵbr the solution
nγ(ϵ) can be found by
inserting first the second branch of ne into Eq. (22) and then by using the derived expression
for ns(x) in Eq. (21). The results are summarized below
(39)After
having determined the form of the electron distribution we can then calculate the
steady-state solutions for γ-rays and soft photons. For
ϵ ≤ ϵbr the injected spectrum remains
unaffected by automatic quenching, whereas for
ϵ > ϵbr the solution
nγ(ϵ) can be found by
inserting first the second branch of ne into Eq. (22) and then by using the derived expression
for ns(x) in Eq. (21). The results are summarized below
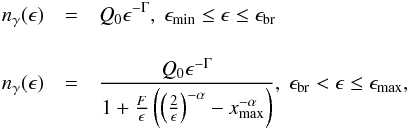 (40)where
α = Γ/2 + 1 and
(40)where
α = Γ/2 + 1 and
 (41)As
the solution for ne is not valid for
γ ≳ γbr (see Eq. (39)), the behaviour of
nγ close to the transition, i.e. for
ϵ ≳ ϵbr, should also be considered with
caution. The validity range set by Eq. (39) can be translated into terms of photon energies, i.e.
ϵ > ϵ⋆, where
(41)As
the solution for ne is not valid for
γ ≳ γbr (see Eq. (39)), the behaviour of
nγ close to the transition, i.e. for
ϵ ≳ ϵbr, should also be considered with
caution. The validity range set by Eq. (39) can be translated into terms of photon energies, i.e.
ϵ > ϵ⋆, where
 (42)It
can be easily verified that for
ϵ > ϵ⋆ the second
term in the denominator of nγ is larger than
unity6, which simplifies the functional dependence
of nγ on energy, i.e.
nγ ∝ ϵ− 3Γ/2.
Summarizing, we find that the asymptotic photon index of a spontaneously quenched
γ-ray spectrum is well defined and it is given by 3Γ/2; this result is
in complete agreement with the one derived numerically in PM11 (see Fig. 9 therein). The
spectral break in the case of automatic quenching depends, therefore, linearly on the
photon index at injection, i.e. ΔΓ = Γ/2.
(42)It
can be easily verified that for
ϵ > ϵ⋆ the second
term in the denominator of nγ is larger than
unity6, which simplifies the functional dependence
of nγ on energy, i.e.
nγ ∝ ϵ− 3Γ/2.
Summarizing, we find that the asymptotic photon index of a spontaneously quenched
γ-ray spectrum is well defined and it is given by 3Γ/2; this result is
in complete agreement with the one derived numerically in PM11 (see Fig. 9 therein). The
spectral break in the case of automatic quenching depends, therefore, linearly on the
photon index at injection, i.e. ΔΓ = Γ/2.
Figure 2 shows the γ-ray spectra given by Eq. (40) for Γ = 2 along with ϵ⋆ (crosses) for different values of the injection parameter Q0 that ensure the operation of spontaneous photon quenching. Our solution for ϵ > ϵbr becomes progressively valid over a larger range of energies as Q0 increases. Moreover, for the highest value of Q0, the photon index of the quenched part of the spectrum is 3, i.e. it has obtained its asymptotic value defined by 3Γ/2. The analytical solutions presented in Fig. 2 are compared to those derived using the numerical code described in the following section and PM11. Solid and dashed lines in Fig. 3 correspond to the analytical and numerical solutions respectively. The agreement between the two is better for larger values of the injection compactness, i.e. when the absorption term in the equation of γ-ray photons becomes larger.
Before closing the present section and for reasons of completeness we will make a short comment on our choice of assuming continuous instead of catastrophic energy losses of electrons. We have also derived the steady-state solution in the case of monoenergetic injection of Nγ-rays using catastrophic losses. However, the obtained results, when compared to the numerically derived results, were not reasonable, in the sense that no large spectral breaks were produced because γ-ray absorption was underestimated. The main reason behind this disagreement with the numerically derived results is the approximation 4. By assuming catastrophic losses of the produced pairs we neglect soft photons with x < bϵ2/4, i.e. we artificially decrease the optical depth for absorption of a γ-ray photon with certain energy ϵ. Thus, although the assumption of catastrophic losses proves to be suffiecient for the derivation of ℓγ,cr (Sect. 2.1) it proves to be too crude for more quantitative results.
3. Numerical approach
In this section we will present
-
(i)
the dependence of the critical injection compactness onvarious parameters, e.g. on the minimum and maximum energyof injected γ-rays, as well as on on the γ-ray photon index, for a widerange of values.
-
(ii)
the effects that the presence of low-energy photons has on the automatic absorption of γ-rays.
For a detailed study of the above a numerical treatment is required; as far as the first point is concerned, we have already shown that the analytical approach breaks down (for example, see Sect. 2.1 for sufficiently high values of the minimum energy of injected γ-rays).
To numerically investigate the properties of quenching one needs to solve again the system of Eqs. (5) and (6), where the discretized photon number densities should be replaced by their continuous functional form. For completeness we have augmented it to include more physical processes.
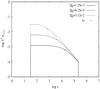 |
Fig. 2 Analytical solution of steady-state spontaneously quenched γ-ray spectra for different values of the injection parameter Q0 starting from 1.25 × 10⁻³. Each value is increased by a factor of 5 over its previous value. Crosses denote in each case the value of ϵ⋆. Other parameters used are: Γ = 2, ϵmin = 33, ϵmax = 2.3 × 10⁵, B = 40 G, and R = 3 × 1016 cm. The break energy is then ϵbr = 160. |
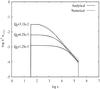 |
Fig. 3 Numerical (dashed lines) and analytical (solid lines) solutions for the steady-state γ-ray spectra. The injection rate increases from bottom to top starting from Q0 = 1.25 × 10⁻³. The parameters used are the same as in Fig. 2. |
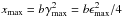
As in the numerical code, there is no need to treat the time-evolution of soft photons and
γ-rays through separate equations, the system can be written
 (43)and
 (44)where
ne and nγ are the
differential electron and photon number densities, respectively, normalized as in Sect. 2.
Here we considered the following processes: (i) photon-photon pair production that acts as a
source term for electrons (
(44)where
ne and nγ are the
differential electron and photon number densities, respectively, normalized as in Sect. 2.
Here we considered the following processes: (i) photon-photon pair production that acts as a
source term for electrons ( ) and a sink term for
photons (
) and a sink term for
photons ( ); (ii)
synchrotron radiation that acts as a loss term for electrons
(
); (ii)
synchrotron radiation that acts as a loss term for electrons
( ) and a source
term for photons (
) and a source
term for photons ( ); (iii) synchrotron
self-absorption that acts as a loss term for photons
(
); (iii) synchrotron
self-absorption that acts as a loss term for photons
( ); and (iv)
inverse Compton scattering that acts as a loss term for electrons
(
); and (iv)
inverse Compton scattering that acts as a loss term for electrons
( ) and a source
term for photons (
) and a source
term for photons ( ). In addition to the
above, we assume that γ-rays are injected into the source through the term
(
). In addition to the
above, we assume that γ-rays are injected into the source through the term
( ). The functional
forms of the various rates have been presented elsewhere (Mastichiadis & Kirk 1995, 1997;
Petropoulou & Mastichiadis 2009). The
photons are assumed to escape the source in one crossing time, therefore
tγ,esc = R/c.
The electron physical escape timescale from the source te,esc is
another free parameter that, however, is not important in our case. Thus, we will fix it at
value
te,esc = tγ,esc = R/c.
The final settings are the initial conditions for the electron and photon number densities.
Because we are investigating the spontaneous growth of pairs and their emitted synchrotron
photons, we assume that at t = 0 there are no electrons in the source, so
we set ne(γ,0) = η → 0.
Moreover, during the injection of photons in a certain γ-ray energy range
it is important to keep the background photons used in the numerical code at a level as low
as possible in order to avoid artificial growth of the instability.
). The functional
forms of the various rates have been presented elsewhere (Mastichiadis & Kirk 1995, 1997;
Petropoulou & Mastichiadis 2009). The
photons are assumed to escape the source in one crossing time, therefore
tγ,esc = R/c.
The electron physical escape timescale from the source te,esc is
another free parameter that, however, is not important in our case. Thus, we will fix it at
value
te,esc = tγ,esc = R/c.
The final settings are the initial conditions for the electron and photon number densities.
Because we are investigating the spontaneous growth of pairs and their emitted synchrotron
photons, we assume that at t = 0 there are no electrons in the source, so
we set ne(γ,0) = η → 0.
Moreover, during the injection of photons in a certain γ-ray energy range
it is important to keep the background photons used in the numerical code at a level as low
as possible in order to avoid artificial growth of the instability.
3.1. Critical γ-ray compactness for power-law injection
The procedure we follow for the numerical determination of the critical compactness is as
follows. We start by injecting γ-rays at a low rate in a specific energy
range (ϵmin,ϵmax), e.g.
ℓinj ≃ 10-5, and then we increase
ℓinj over its previous value by a factor of 0.2 in
logarithm. The increase of ℓinj is directly related to the
increase of the normalization Q0 of the injection
γ-ray spectrum; we note that 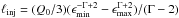 for Γ ≠ 2. For each value
we allow the system to reach a steady state and then we examine the shape of the
γ-ray spectrum. We define as
ℓγ,cr that value of
ℓinj that causes the first deviation from the spectral shape
at injection; for this reason, we consider it to be a strict limit.
for Γ ≠ 2. For each value
we allow the system to reach a steady state and then we examine the shape of the
γ-ray spectrum. We define as
ℓγ,cr that value of
ℓinj that causes the first deviation from the spectral shape
at injection; for this reason, we consider it to be a strict limit.
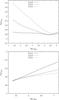 |
Fig. 4 Log–log diagram of the critical γ-ray compactness as a function of ϵmin for constant ϵmax = 2.3 × 10⁵ (top panel) and as a function of ϵmax for constant ϵmin = 1.4 × 10⁵ (bottom panel) for three photon indices marked on the plot. Other parameters used are B = 40 G and R = 3 × 1016 cm. |
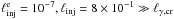
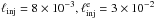
Figure 4 shows ℓγ,cr as a function of ϵmin (top panel) or ϵmax (bottom panel) for three different slopes of the injection spectrum marked on the plot. Other parameters used are B = 40 G and R = 3 × 1016 cm. In the top panel, the maximum energy of the power-law spectrum is fixed at ϵmax = 2.3 × 10⁵, whereas in the bottom panel the minimum energy is taken to be constant and equal to ϵmin = 1.4 × 10⁵. For soft injection spectra, e.g. Γ = 2.4, we find that ℓγ,cr strongly depends on ϵmin. The situation is exactly the opposite for hard γ-ray spectra (see solid line in bottom panel of the same figure). The critical compactness that we derive for ϵmin ≈ ϵmax ≈ 2.5 × 10⁵ is ℓγ,cr ≈ 2 × 10⁻³ (see bottom panel of Fig. 4) and it corresponds to monoenergetic γ-ray injection. Thus, it should be compared to ℓγ,cr ≈ 5 × 10⁻⁴, which was derived analytically in PM11 for δ-function injection at ϵ = 2.5 × 10⁵ (see Fig. 2 therein). The difference between the two results is not worrying, since the analytical values in PM11 were about a factor of four lower than the accurate values that were derived numerically.
3.2. Effects of a primary soft photon component
The main difference between automatic γ-ray absorption and the widely used photon-photon absorption on a pre-existing photon field (primary photons), is that in the first case no target field is initially present in the source. It is as if the system finds its own equilibrium by self-producing the soft photons required for quenching the extra γ-ray luminosity. In many physical scenarios, however, primary photons are present in the source, e.g. synchrotron radiation from primary electrons, and therefore γ-rays are more likely to be absorbed on both primary and secondary photon fields. Here arises the question whether or not the effects of spontaneous photon quenching can be disentagled from those of linear absorption7.
In the limiting cases where γ-rays are being absorbed on either primary
or secondary soft photons there is a straighforward relation between the photon index of
the absorbed γ-ray spectrum and that of photon target field 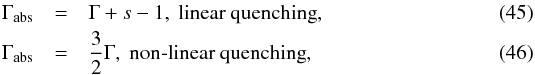 where
s is the photon index of the primary photon distribution (see Appendix
A for the derivation of Γabs in the first case).
where
s is the photon index of the primary photon distribution (see Appendix
A for the derivation of Γabs in the first case).
Using the numerical code presented in Sect. 3 we will first verify the above analytical
relations and then study intermediate cases. For this, we assume a spherical region with
size R = 3 × 1016 cm containing a magnetic field
B = 40 G. Very high energy γ-rays with a photon index
Γ = 2.4 are injected into this volume between energies
ϵmin = 23 and
ϵmax = 2.3 × 10⁵ with compactness
ℓinj being a free parameter. Primary photons are produced
via synchrotron radiation of a power-law electron distribution with index
p = 1.5. The maximum Lorentz factor γmax
and the electron injection compactness  , which is
defined as
, which is
defined as 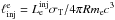 , are also free
parameters; here
, are also free
parameters; here  is the
total electron injection luminosity. The only processes we consider in the following
examples are synchrotron emission, photon-photon absorption, and escape from the source.
We note that the effect of inverse Compton scattering is negligible for the magnetic field
and electron energies assumed here. The results regarding the two regimes are summarized
in Fig. 5. In the top panel we have used
is the
total electron injection luminosity. The only processes we consider in the following
examples are synchrotron emission, photon-photon absorption, and escape from the source.
We note that the effect of inverse Compton scattering is negligible for the magnetic field
and electron energies assumed here. The results regarding the two regimes are summarized
in Fig. 5. In the top panel we have used
 (solid line) and
  (dashed line), while we kept γmax = 3.6 × 10⁵
fixed. For these parameter values the maximum energies of primary and secondary
synchrotron photons are 10-1 and 1.3 × 10⁻², respectively. The
slopes of different power-law segments in a
x2nγ(x)
plot are also shown. The spectral break of the γ-ray spectrum differs
between the two regimes and the numerical results are in agreement with those given by
Eqs. (45) and (46). In particular, we find that the absorbed
γ-ray spectrum has a photon index Γabs = 3.5 which should be
compared to 3Γ/2 = 3.6 for the non-linear quenching case. To estimate the spectral change
for the linear absorption case the photon index of the soft photon distribution is
required, which in this example is s = (p/2) + 1 = 1.75.
The expected value of Γabs is 3.15 while the derived value is 3. We also note
that the spectral shape of the synchrotron component emitted by the produced pairs (solid
line) is in agreement with that expected from our solution for the electron distribution
(see Eq. (38)); emission from lower energy
electrons (ne ∝ γ-2) results in
nγ ∝ x− 3/2,
while from higher energy electrons
(ne ∝ γ−Γ−1) corresponds to
ns ∝ x−Γ/2−1 = x-2.2.
In the bottom panel, along with the examples shown in the top panel (solid and dash-dotted
lines), we plot two intermediate cases with a progressively higher γ-ray
compactness, i.e. ℓinj = 8 × 10⁻² (dashed line) and
ℓinj = 8 × 10⁻¹ (dotted line), while we used the
same
(dashed line), while we kept γmax = 3.6 × 10⁵
fixed. For these parameter values the maximum energies of primary and secondary
synchrotron photons are 10-1 and 1.3 × 10⁻², respectively. The
slopes of different power-law segments in a
x2nγ(x)
plot are also shown. The spectral break of the γ-ray spectrum differs
between the two regimes and the numerical results are in agreement with those given by
Eqs. (45) and (46). In particular, we find that the absorbed
γ-ray spectrum has a photon index Γabs = 3.5 which should be
compared to 3Γ/2 = 3.6 for the non-linear quenching case. To estimate the spectral change
for the linear absorption case the photon index of the soft photon distribution is
required, which in this example is s = (p/2) + 1 = 1.75.
The expected value of Γabs is 3.15 while the derived value is 3. We also note
that the spectral shape of the synchrotron component emitted by the produced pairs (solid
line) is in agreement with that expected from our solution for the electron distribution
(see Eq. (38)); emission from lower energy
electrons (ne ∝ γ-2) results in
nγ ∝ x− 3/2,
while from higher energy electrons
(ne ∝ γ−Γ−1) corresponds to
ns ∝ x−Γ/2−1 = x-2.2.
In the bottom panel, along with the examples shown in the top panel (solid and dash-dotted
lines), we plot two intermediate cases with a progressively higher γ-ray
compactness, i.e. ℓinj = 8 × 10⁻² (dashed line) and
ℓinj = 8 × 10⁻¹ (dotted line), while we used the
same  .
Already from ℓinj = 8 × 10⁻², which is still above
the critical value, the contribution of photons produced via automatic
γ-ray quenching is evident as a bump in the primary soft photon
component. We note also that the presence of primary soft photons enhances the automatic
absorption of γ-rays for the same ℓinj
(compare the dotted and dash-dotted lines).
.
Already from ℓinj = 8 × 10⁻², which is still above
the critical value, the contribution of photons produced via automatic
γ-ray quenching is evident as a bump in the primary soft photon
component. We note also that the presence of primary soft photons enhances the automatic
absorption of γ-rays for the same ℓinj
(compare the dotted and dash-dotted lines).
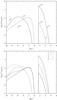 |
Fig. 5 Top panel: comparison between two limiting cases where
γ-ray photons are absorbed only on synchrotron photons emitted by
secondary pairs (solid line) or by primary electrons (dashed line). The injection
compactnesses of γ-rays and primary electrons are
|

4. Implications on γ-ray emitting blazars
4.1. General remarks
The mechanism of automatic photon quenching sets an upper limit to the intrinsic γ-ray luminosity of a compact source and, therefore, can be applied on γ-ray emitting blazars for constraining physical quantities of their VHE emission region (for more details see PM11 and Petropoulou & Mastichiadis 2012a, hereafter PM12a). This can be relevant to recent observations that have revealed the presence of very hard intrinsic TeV γ-ray spectra of blazars, even when corrected with low extragalactic background light (EBL) flux levels, e.g. 1ES 1101-232 (Aharonian et al. 2006) and 1ES 0229+200 (Aharonian et al. 2007). The SEDs of some hard γ-ray sources are very difficult to explain within one-zone emission models, and therefore, they are often attributed to a second component, whose emission in longer wavelengths is hidden by that of the first component (e.g. Costamante 2012). Thus, the physical conditions of the component emitting in the TeV energy range can be chosen quite arbitrarily only by demanding to fit the VHE part of the spectrum. The presence of very hard TeV γ-ray spectra (typically Γint ≃ 1.5) implies that these sources cannot be spontaneously quenched, i.e. their intrinsic γ-ray luminosity should be less than the critical one. We note, however, that there is an alternative scenario that employs the photon-photon absorption on internal soft photon fields that explains the formation of very hard intrinsic γ-ray spectra (Aharonian et al. 2008).
By now there are several simultaneous and quasi-simultaneous observations of blazars in the GeV and TeV energy range, which clearly show that the γ-ray spectrum cannot be fitted by a simple power-law over the whole GeV-TeV energy range, but rather by a broken power-law. The change of the photon index in many cases is large (ΔΓ ≳ 1) and it cannot be explained using simple arguments such as cooling breaks (ΔΓ = 0.5). In particular, for high-peaked blazars that are bright in the Fermi energy band (e.g. Mrk421, PKS 2155-304, PKS 0447-439, etc.), the peak of their SED seems to fall in the high-GeV energy part of the spectrum (≃100 GeV). In these cases GeV and TeV emission correspond to parts of the spectrum below and above the high-energy hump respectively. Thus, it is commonly considered that the VHE γ-ray spectra are intrinsically much softer (e.g. exponential cutoff effects) than the GeV spectra (Costamante 2012).
Here, however, we investigate another explanation of γ-ray spectral breaks. In our framework, the injection γ-ray spectrum is described by a single power-law from GeV up to TeV energies, and the spectrum of the escaping γ-ray radiation is modified due to internal spontaneous photon absorption. We note that the instability of automatic photon quenching offers an alternative mechanism for producing intrinsic broken power-law spectra (see Sect. 2).
A plot of the photon index in the GeV energy band (as measured by the Fermi satellite) versus the one in the TeV energy band (as measured by MAGIC and H.E.S.S. telescopes) is shown in Fig. 6. The sources used for this plot are listed in Table 1 along with the observed values of the photon indices and the reference papers. Filled and open symbols show the photon indices of the observed and of the corrected for EBL absorption VHE spectra. We note that in all cases we used the model C by Finke et al. (2010) for the EBL correction; in this model, the EBL flux from UV to the near – IR is also similar to that of Domínguez et al. (2011). Different symbols, in particular circles and squares, denote TeV observations made by MAGIC and H.E.S.S., respectively. The solid line represents the relation between the photon indices that is expected by spontaneous photon quenching, i.e. ΓTeV = 3ΓGeV/2, whereas the dashed line (ΓTeV = ΓGeV) is plotted only to guide the eye. Some of the data points within their error bars are compatible with the theoretical predictions. For the purposes of the present work, the choice of a particular EBL model does not significantly affect our results. For example, the EBL model used here predicts slightly higher optical depth than the one of Franceschini et al. (2008) for Eγ ≲ 5 TeV (10 TeV) for z = 0.6 (0.1), respectively. Thus, correction of the VHE spectra with the EBL model of Franceschini et al. (2008) would result in slightly softer intrinsic VHE spectra, i.e. some of the open symbols in Fig. 6 would move upwards in the vertical direction. Moreover, the fact that the analysis of the Fermi and MAGIC/H.E.S.S./VERITAS data has not been made over the same energy intervals for all sources listed in Table 1 makes difficult to draw any conclusions regarding the statistical properties of this sample. Non-simultaneity of GeV and TeV observations in some cases, e.g. NGC 1275, also makes any coherent comparison difficult. For these reasons, this type of plot could be used only as a first indicator for searching among sources that could be explained by the mechanism of automatic quenching.
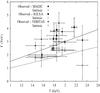 |
Fig. 6 Photon index of the TeV spectrum versus the one of the GeV spectrum for several γ-ray emitting blazars. |
In these cases, there are five additional features that can be tested observationally:
-
(i)
Automatic photon quenching is a radiative instability thatredistributes the energy within a photon population. Theabsorbed γ-ray luminosity appears, therefore, in the lower part ofthe multiwavelength (MW) spectrum, usually in the X-rayregime.
-
(ii)
The spectral break in the γ-ray spectrum of blazars that have low X-ray emission compared to that of VHE γ-rays cannot, in general, be attributed to automatic photon absorption.
-
(iii)
If the VHE γ-ray spectrum is spontaneously absorbed, there is a straighforward relation between the photon indices of the absorbed part of the γ-ray spectrum and that of the soft photon component. In Sect. 2.3 we have shown that Γabs = 3Γ/2, where Γ is the photon index of the γ-ray spectrum at injection. The steady state electron distribution due to pair production is ne(γ) ∝ γ−Γ−1 (see Eq. (38)) and the corresponding photon index of the synchrotron spectrum is given by Γsoft = Γ/2 + 1. Thus, the relation between the two photon indices is Γabs = 3(Γsoft−1) (see also the numerical example in the top panel of Fig. 5).
-
(iv)
Strong correlation between the soft component of the MW spectrum and the unabsorbed part of the γ-ray spectrum is to be expected in cases where the intrinsic γ-ray luminosity varies.
-
(v)
An increase of the intrinsic γ-ray compactness is accompanied by a shift of the break energy towards lower energies.
As far as the first observational prediction is concerned, one can show that the maximum
energy of the soft component produced by automatic photon quenching falls for reasonable
parameter values, in the X-ray regime. First, the feedback criterion for automatic
quenching must be satisfied, at least, by γ-ray photons having the
maximum energy (see also Sect. 2). This is written as  (47)where
we have used the observed quantities instead of those measured in the comoving frame of
the blob that has a Doppler factor δ. From this point on and in what
follows the convention
EX ≡ E/10X
in eV will be adopted for photon energies, unless stated otherwise8. In Sect. 2 we have shown that a spontaneously quenched
γ-ray spectrum shows a break at the energy
(47)where
we have used the observed quantities instead of those measured in the comoving frame of
the blob that has a Doppler factor δ. From this point on and in what
follows the convention
EX ≡ E/10X
in eV will be adopted for photon energies, unless stated otherwise8. In Sect. 2 we have shown that a spontaneously quenched
γ-ray spectrum shows a break at the energy
 . Combining this expression with
the fact that the observed break energy
. Combining this expression with
the fact that the observed break energy  usually
lies in the GeV energy band, we derive a second relation between the magnetic field and
the Doppler factor of the blob
usually
lies in the GeV energy band, we derive a second relation between the magnetic field and
the Doppler factor of the blob  (48)Since
the break energy is by definition smaller than the maximum energy, the magnetic field
Bbr always satisfies the inequality in Eq. (47). We note that the magnetic field required
is, generally, strong. Even for a small value of the Doppler factor, e.g.
δ = 10, one needs B ≃ 40 G (see also PM12a for a
related discussion). Thus, spontaneously quenched γ-ray spectra cannot
operate in the context of one-zone leptonic models, such as synchrotron self-Compton (SSC)
that usually requires weak magnetic fields (e.g. Böttcher
et al. 2009). Finally, the observed maximum energy of the produced soft photons
is given by
(48)Since
the break energy is by definition smaller than the maximum energy, the magnetic field
Bbr always satisfies the inequality in Eq. (47). We note that the magnetic field required
is, generally, strong. Even for a small value of the Doppler factor, e.g.
δ = 10, one needs B ≃ 40 G (see also PM12a for a
related discussion). Thus, spontaneously quenched γ-ray spectra cannot
operate in the context of one-zone leptonic models, such as synchrotron self-Compton (SSC)
that usually requires weak magnetic fields (e.g. Böttcher
et al. 2009). Finally, the observed maximum energy of the produced soft photons
is given by  (49)where
we have used the magnetic field strength given by Eq. (48).
(49)where
we have used the magnetic field strength given by Eq. (48).
If a γ-ray emitting blazar happens to be a spontaneously quenched
source, then one can make a strong prediction about the flux correlation between soft
(usually X-ray) photons, the unabsorbed part of the γ-ray spectrum (GeV
energy band) and the absorbed one (typically TeV energy band). Increase of the intrinsic
γ-ray compactness amplifies, in general, the absorption of VHE
γ-rays, which leads to an increase of the soft photon component. The
number of photon targets for the γ-rays is then increased, which further
sustains the non-linear loop of photon-photon absorption. The part of the
γ-ray spectrum that is not affected by automatic quenching follows
exactly the variations of the injection compactness, whereas the spontaneously quenched
varies in the inverse way. The above are shown in Fig. 7. First, we allowed the system to reach a steady state (for the parameters used
see Fig. 7). Then, we imposed a Lorentzian variation
on the injected γ-ray compactness:
 (50)where
τ is the comoving time in units of tcr and
(50)where
τ is the comoving time in units of tcr and
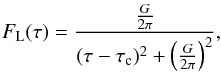 (51)where
τc and G are free parameters that control
the position of the maximum and the width at half maximum, respectively. Then, we
calculated the photon compactness of the soft component
(
(51)where
τc and G are free parameters that control
the position of the maximum and the width at half maximum, respectively. Then, we
calculated the photon compactness of the soft component
( ) of the unabsorbed
(ϵmin ≤ ϵ ≤ 10ϵmin ≈ ϵbr)
and spontaneously quenched
(0.1ϵmax ≤ ϵ ≤ ϵmax)
γ-rays and plotted them as a function of time in Fig. 7. The evolution of the break energy of the spectrum from
high to lower energies can be seen in Fig. 8, where
snapshots of MW spectra are plotted.
) of the unabsorbed
(ϵmin ≤ ϵ ≤ 10ϵmin ≈ ϵbr)
and spontaneously quenched
(0.1ϵmax ≤ ϵ ≤ ϵmax)
γ-rays and plotted them as a function of time in Fig. 7. The evolution of the break energy of the spectrum from
high to lower energies can be seen in Fig. 8, where
snapshots of MW spectra are plotted.
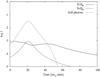 |
Fig. 7 Plot of photon compactness as a function of time for various components. Absorbed and unabsorbed γ-rays are plotted with solid and dashed lines, respectively, while soft photons are shown with a dotted line. Parameters used for this plot: ϵmax = 2.3 × 10⁵, ϵmin = 23, Γ = 1.5, B = 40 G, R = 3 × 1016 cm, ℓinj = 1.7 × 10⁻³ ≳ ℓγ,cr, G = 10, and τc = 20. |
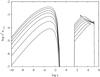 |
Fig. 8 Snapshots of MW spectra obtained for a variable γ-ray injection compactness. The type of variation and the parameter values are the same as in Fig. 7. The arrow shows the so-called hard-to-soft evolution of the γ-ray spectrum break energy. |
4.2. Application to blazar PKS 0447-439
The bright blazar PKS 0447-439 has recently been detected at high energy (Abdo et al. 2009a) and VHE (Abramowski et al. 2013) γ-rays. Although the redshift of the source is still disputable (see e.g. Prandini et al. 2012; Pita et al. 2012, for different estimations and discussions), in the following we will adopt the value z = 0.2. Furthermore, a higher redshift, that is equivalent to a larger optical depth for γγ absorption, would imply a harder intrinsic VHE spectrum and, therefore, a smaller value of ΔΓ ≡ ΓTeV − ΓGeV. However, taking into account the errorbars of the photon indices, a fit can still be achieved for a range of redshift values (0.1 < z < 0.24). We have focused on PKS 0447-439 since it satisfies most of the conditions that were presented in the previous section. In particular:
-
The photon indices in the GeV and TeV energy ranges areΓGeV = 1.85 ± 0.05 and ΓTeV ≈ 2.5 ± 0.37, respectively9. This is in agreement with what we have shown, i.e. that a γ-ray spectrum with Γ = 1.8 can steepen up to Γ = 2.7 owing to spontaneous quenching.
-
The X-ray luminosity is less than the γ-ray luminosity but of the same order of magnitude.
-
An anticorrelated variability between VHE γ-rays and X-rays may be suggested, although the number of data points is small and therefore still inconclusive (see Fig. 5 in Abramowski et al. 2013).
As a first attempt, we did not specify the production mechanism of
γ-rays. Instead, we assumed that they are being injected into the
emission region with a rate given by
 (52)where
Q0 is a normalization constant that is related to the
injection γ-ray compactness as
(52)where
Q0 is a normalization constant that is related to the
injection γ-ray compactness as 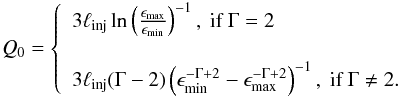 (53)We
also included the injection of primary electrons at a rate
(53)We
also included the injection of primary electrons at a rate
 (54)where
Q0,e is related to the electron injection
compactness in the same way as in Eq. (53). The parameters of the fit shown in Fig. 9 can be found in Table 2.
(54)where
Q0,e is related to the electron injection
compactness in the same way as in Eq. (53). The parameters of the fit shown in Fig. 9 can be found in Table 2.
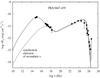 |
Fig. 9 Multiwavelength spectrum of PKS 0447-439 during the period November 2009–January 2010. Filled squares represent the Swift/UVOT, Swift/XRT, Fermi, and H.E.S.S. data from low to high energies respectively. Solid and dashed lines show the SEDs with and without the injection of primary electrons. Our model SEDs are corrected for EBL absorption asumming z = 0.2 and using model C of Finke et al. (2010). |
Figure 9 shows that the synchrotron emission of secondary electron/positron pairs explains the X-ray emission, while the synchrotron emission from primary leptons is required to fit the optical data. In this example, primary soft photons, i.e. photons that are not produced by automatic quenching of γ-rays, are not targets for photon-photon absorption because of their low energies, and therefore, linear absorption does not interfere with the non-linear one. We note that inverse Compton scattering was also taken into account; both primary and secondary soft photon fields were used in the scatterings. As a second step, one could attribute γ-ray emission to a particular production mechanism, e.g. to synchrotron radiation from relativistic protons, since the choice of a relatively large value of the magnetic field makes the application of automatic photon quenching more relevant to hadronic emission models; a detailed hadronic modelling of the source, however, lies outside the scope of the present paper.
5. Discussion
A very interesting, yet largely unnoticed property of γ-ray radiation transfer is the presence of an upper limit at the production rate per volume of γ-ray photons. If the γ-ray compactness at injection exceeds this critical value, then soft photons are produced spontaneously in the source, serve as targets for high-energy photons, and absorb the excessive γ-ray luminosity. Thus, soft photons act as a thermostat and appear irrespective of the γ-ray production mechanism. These ideas were put forward in SK07, who coined the term “automatic photon quenching” to describe this non-linear mechanism, and were expanded by PM11 and PM12b. The present paper continues the exploration of automatic quenching in the case where γ-rays are injected with a power-law distribution. Therefore, this can be considered a continuation of an earlier work (PM11), in which the quenching in the case of monoenergetic γ-ray injection was studied.
In Sect. 2 we have derived an analytical expression of the critical compactness that is required for an injected power-law γ-ray spectrum to be quenched. A series of approximations/assumptions, which were presented in detail in the same section, were necessary for the above derivation. In particular, the catastrophic losses approximation for electrons proved to be crude enough and made our analytical results valid in a particular parameter range; we have commented on that through an indicative example, where the analytically and numerically derived values of the critical compactness were compared. In cases where automatic photon quenching applies, we have calculated the steady-state γ-ray spectra and shown that spontaneous photon absorption produces a break of ΔΓ = Γ/2 between the unabsorbed and the absorbed parts of the injected power-law; here Γ is the slope of the injected γ −rays.
In Sect. 3 we have implemented a numerical code that solves the full radiative transfer problem inside a spherical volume, in order to derive the critical γ-ray compactness for a wide range of parameter values, e.g. for various photon indices, as well as for different minimum and maximum energies of the γ-ray spectrum. We have also examined the effects that a primary soft photon component would have on the absorption of γ-rays. We found that these depend on both the compactness and the spectral shape of the external component.
In Sect. 4 we have examined the implications of quenching on γ-ray emitting blazars. We have also given a set of crireria that can be used in order to deduce, observationally, whether a γ-ray blazar is spontaneously quenched or not. We note that the relevant information is imprinted both on the SED and on the variability patterns of the source. We also point out that blazar PKS 0477-439 meets several of the criteria and there is a distinct possibility that its high-energy spectrum is quenched, while the X-rays are produced from the reprocession of γ-rays.
In the present paper we have intentionally avoided pinpointing a specific mechanism for γ-ray production. However, the range of parameters used and especially the choice of a rather large magnetic field value (of the order of a few Gauss), imply that these ideas are more effectively applied to hadronic models. In this case γ-rays could be produced either by proton-synchrotron radiation or by pion production (Mastichiadis et al. 2013).
Automatic quenching might have some far-reaching implications for γ-ray blazars. If there is evidence that it operates at some level, then part (or all) of the UV/X-ray component should be reprocessed γ-ray emission, i.e. there is no need for a primary component to produce all of the observed soft radiation. It also predicts that, for AGN related parameters, breaks in the γ-ray spectra should appear in the high GeV – low TeV regime. Moreover, a hard-to-soft evolution of the spectral break is expected whenever the injected γ-ray flux increases. Therefore, future observations, especially with CTA (Sol et al. 2013), could prove decisive in detecting the presence of such spectral breaks. If, on the other hand, the sources do not show signs of spontaneous quenching, then some interesting constraints apply to the source parameters, as this relates the γ-ray luminosity to the size of the source, the magnetic field strength and the Doppler factor (see PM12a for an application of this kind on quasar 3C 279). These constraints can be quite severe, especially if the source undergoes strong flaring episodes and the absence of quenching could only mean either a very large value of the Doppler factor or a low magnetic field in the production region. Both aspects have strong implications for the physical conditions prevailing in the emitting regions of γ-ray blazars.
Similar results are presented in Mastichiadis et al. (2005) but they are caused by a different intrinsic non-linear process known as the “PPS-loop” (Kirk & Mastichiadis 1992).
For a 100 GeV γ-ray photon, the dimensionless photon energy is ϵ = 2 × 10⁵ and the produced pairs have γ ≈ ϵ/2 = 105.
For a continuous power-law injection of photons, the relation between the differential photon number density and compactness is ℓinj(ϵ) = nγ(ϵ)ϵ/3, while the total injection compactness is calculated by ℓinj = ∫dϵ ℓinj(ϵ).
For more details on the numerical code used, see Sect. 3.
As a minimal condition, we assume that the energy threshold criterion for automatic
photon quenching is satisfied at least from the maximum energy γ-rays,
i.e.  .
.
The physical interpretation of this condition is that the absorption term in the γ-ray photon equation is larger than the escape term. In this energy range, the photon distribution is determined mainly by the automatic quenching.
Discussions on the subject but in the context of differences in variability patterns can be found in PM12b.
Capital and small initial letters are used to differentiate between photon energies with and without dimensions, respectively.
The VHE photon index is calculated after correcting for EBL absortpion for z = 0.2 and using the model by Finke et al. (2010).
Acknowledgments
We would like to thank the anonymous referee for useful comments/suggestions on the manuscript and Dimitra Lingri for helping us compile Table 1. This research has been co-financed by the European Union (European Social Fund – ESF) and Greek national funds through the Operational Program “Education and Lifelong Learning” of the National Strategic Reference Framework (NSRF) – Research Funding Program: Heracleitus II. Investing in knowledge society through the European Social Fund.
References
- Abdo, A. A., Ackermann, M., Ajello, M., et al. 2009a, ApJS, 183, 46 [NASA ADS] [CrossRef] [Google Scholar]
- Abdo, A. A., Ackermann, M., Ajello, M., et al. 2009b, ApJ, 700, 597 [NASA ADS] [CrossRef] [Google Scholar]
- Abdo, A. A., Ackermann, M., Ajello, M., et al. 2011a, ApJ, 727, 129 [NASA ADS] [CrossRef] [Google Scholar]
- Abdo, A. A., Ackermann, M., Ajello, M., et al. 2011b, ApJ, 736, 131 [NASA ADS] [CrossRef] [Google Scholar]
- Abramowski, A., Acero, F., Aharonian, F., et al. (H.E.S.S. Collaboration) 2011, A&A, 533, A110 [NASA ADS] [CrossRef] [EDP Sciences] [Google Scholar]
- Abramowski, A., Acero, F., Aharonian, F., et al. (H.E.S.S. Collaboration) 2012, A&A, 538, A103 [NASA ADS] [CrossRef] [EDP Sciences] [Google Scholar]
- Abramowski, A., Acero, F., Akhperjanian, A. G., et al. (H.E.S.S. Collaboration) 2013, A&A, 552, A118 [NASA ADS] [CrossRef] [EDP Sciences] [Google Scholar]
- Acciari, V. A., Aliu, E., Arlen, T., et al. 2010a, ApJ, 708, L100 [NASA ADS] [CrossRef] [Google Scholar]
- Acciari, V. A., Aliu, E., Arlen, T., et al. 2010b, ApJ, 715, L49 [NASA ADS] [CrossRef] [Google Scholar]
- Aharonian, F., Akhperjanian, A. G., Bazer-Bachi, A. R., et al. 2006, Nature, 440, 1018 [NASA ADS] [CrossRef] [PubMed] [Google Scholar]
- Aharonian, F., Akhperjanian, A. G., Barres de Almeida, U., et al. 2007, A&A, 475, L9 [NASA ADS] [CrossRef] [EDP Sciences] [Google Scholar]
- Aharonian, F. A., Khangulyan, D., & Costamante, L. 2008, MNRAS, 387, 1206 [NASA ADS] [CrossRef] [Google Scholar]
- Aleksić, J., Antonelli, L. A., Antoranz, P., et al. 2010, ApJ, 723, L207 [NASA ADS] [CrossRef] [Google Scholar]
- Aleksić, J., Antonelli, L. A., Antoranz, P., et al. 2011a, ApJ, 730, L8 [NASA ADS] [CrossRef] [Google Scholar]
- Aleksić, J., Antonelli, L. A., Antoranz, P., et al. 2011b, A&A, 530, A4 [NASA ADS] [CrossRef] [EDP Sciences] [Google Scholar]
- Aleksić, J., Alvarez, E. A., Antonelli, L. A., et al. 2012a, A&A, 544, A142 [NASA ADS] [CrossRef] [EDP Sciences] [Google Scholar]
- Aleksić, J., Alvarez, E. A., Antonelli, L. A., et al. 2012b, A&A, 539, L2 [NASA ADS] [CrossRef] [EDP Sciences] [Google Scholar]
- Aliu, E., Aune, T., Beilicke, M., et al. 2011, ApJ, 742, 127 [NASA ADS] [CrossRef] [Google Scholar]
- Aliu, E., Archambault, S., Arlen, T., et al. 2012, ApJ, 750, 94 [NASA ADS] [CrossRef] [Google Scholar]
- Böttcher, M., & Chiang, J. 2002, ApJ, 581, 127 [NASA ADS] [CrossRef] [Google Scholar]
- Böttcher, M., Reimer, A., & Marscher, A. P. 2009, ApJ, 703, 1168 [NASA ADS] [CrossRef] [Google Scholar]
- Coppi, P. S. 1992, MNRAS, 258, 657 [NASA ADS] [CrossRef] [Google Scholar]
- Coppi, P. S., & Blandford, R. D. 1990, MNRAS, 245, 453 [NASA ADS] [Google Scholar]
- Costamante, L. 2012 [arXiv:1208.0810] [Google Scholar]
- Domínguez, A., Primack, J. R., Rosario, D. J., et al. 2011, MNRAS, 410, 2556 [NASA ADS] [CrossRef] [Google Scholar]
- Finke, J. D., Razzaque, S., & Dermer, C. D. 2010, ApJ, 712, 238 [NASA ADS] [CrossRef] [Google Scholar]
- Franceschini, A., Rodighiero, G., & Vaccari, M. 2008, A&A, 487, 837 [NASA ADS] [CrossRef] [EDP Sciences] [Google Scholar]
- Herterich, K. 1974, Nature, 250, 311 [NASA ADS] [CrossRef] [Google Scholar]
- Jelley, J. V. 1966, Nature, 211, 472 [NASA ADS] [CrossRef] [Google Scholar]
- Kataoka, J., Takahashi, T., Makino, F., et al. 2000, ApJ, 528, 243 [NASA ADS] [CrossRef] [Google Scholar]
- Katarzyński, K., Ghisellini, G., Tavecchio, F., et al. 2005, A&A, 433, 479 [NASA ADS] [CrossRef] [EDP Sciences] [Google Scholar]
- Kazanas, D. 1984, ApJ, 287, 112 [NASA ADS] [CrossRef] [Google Scholar]
- Kirk, J. G., & Mastichiadis, A. 1992, Nature, 360, 135 [NASA ADS] [CrossRef] [Google Scholar]
- Konopelko, A., Mastichiadis, A., Kirk, J., de Jager, O. C., & Stecker, F. W. 2003, ApJ, 597, 851 [NASA ADS] [CrossRef] [Google Scholar]
- Mastichiadis, A., & Kirk, J. G. 1995, A&A, 295, 613 [NASA ADS] [Google Scholar]
- Mastichiadis, A., & Kirk, J. G. 1997, A&A, 320, 19 [NASA ADS] [Google Scholar]
- Mastichiadis, A., Protheroe, R. J., & Kirk, J. G. 2005, A&A, 433, 765 [NASA ADS] [CrossRef] [EDP Sciences] [Google Scholar]
- Mastichiadis, A., Petropoulou, M., & Dimitrakoudis, S. 2013, MNRAS, submitted [arXiv:1304.2957] [Google Scholar]
- Petropoulou, M., & Mastichiadis, A. 2009, A&A, 507, 599 [NASA ADS] [CrossRef] [EDP Sciences] [Google Scholar]
- Petropoulou, M., & Mastichiadis, A. 2011, A&A, 532, A11 [NASA ADS] [CrossRef] [EDP Sciences] [Google Scholar]
- Petropoulou, M., & Mastichiadis, A. 2012a, MNRAS, 426, 462 [NASA ADS] [CrossRef] [Google Scholar]
- Petropoulou, M., & Mastichiadis, A. 2012b, MNRAS, 421, 2325 [Google Scholar]
- Pita, S., Goldoni, P., Boisson, C., et al. 2012, in AIP Conf. Ser., 1505, eds. F. A. Aharonian, W. Hofmann, & F. M. Rieger, 566 [Google Scholar]
- Prandini, E., Bonnoli, G., & Tavecchio, F. 2012, A&A, 543, A111 [NASA ADS] [CrossRef] [EDP Sciences] [Google Scholar]
- Protheroe, R. J. 1986, MNRAS, 221, 769 [NASA ADS] [Google Scholar]
- Sol, H., Zech, A., Boisson, C., et al. 2013, Astropart. Phys., 43, 215 [NASA ADS] [CrossRef] [Google Scholar]
- Stawarz, Ł., & Kirk, J. G. 2007, ApJ, 661, L17 [NASA ADS] [CrossRef] [Google Scholar]
- Stern, B. E., Begelman, M. C., Sikora, M., & Svensson, R. 1995, MNRAS, 272, 291 [NASA ADS] [CrossRef] [Google Scholar]
- Svensson, R. 1987, MNRAS, 227, 403 [NASA ADS] [Google Scholar]
- Zdziarski, A. A., & Lightman, A. P. 1985, ApJ, 294, L79 [NASA ADS] [CrossRef] [Google Scholar]
Appendix A: γ-ray spectral break due to absorption on primary soft photons
We derive the spectral break of a γ-ray spectrum due to the absorption
of a primary soft photon component (nex) that is present in
the emission region. In this case, the absorption of γ-rays is a linear
process in contrast to automatic quenching. We treat the target photon population as a
photon tank, in the sense that nex does not evolve with time.
Thus, the steady-state γ-ray photon spectrum is derived by solving the
same set of equations as those presented in Sect. 2.3, with a slightly different operator
 (and
(and
 ):
):
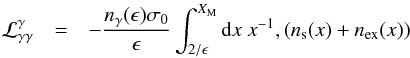 (A.1)where
XM = max [ xmax,x0 ]
and xmax,x0 are the maximum
energies of the secondary and primary soft photons, respectively. The above expression
represents the most general physical case, where γ-rays are being
absorbed by both primary and secondary soft photons. One can distinguish between two
regimes:
(A.1)where
XM = max [ xmax,x0 ]
and xmax,x0 are the maximum
energies of the secondary and primary soft photons, respectively. The above expression
represents the most general physical case, where γ-rays are being
absorbed by both primary and secondary soft photons. One can distinguish between two
regimes:
-
1.
spontaneous or non-linear γ-ray absorption, ifnex(x) ≪ ns(x), and
-
2.
linear γ-ray absorption, if nex(x) ≫ ns(x).
Here we focus on the second regime, where after following the same steps as those
described in Sect. 2.3, we find the steady-state γ-ray distribution
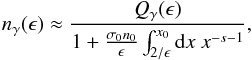 (A.2)where
n0 is the normalization of the primary soft photon
distribution. Since we are interested in calculating the photon index of the absorbed part
of the spectrum, it is sufficient to look at the asymptotic expression of
nγ(ϵ),
(A.2)where
n0 is the normalization of the primary soft photon
distribution. Since we are interested in calculating the photon index of the absorbed part
of the spectrum, it is sufficient to look at the asymptotic expression of
nγ(ϵ),
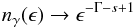 (A.3)that
is obtained for
ϵs−1 ≫ 2ss/σ0n0.
Thus, in this regime the spectral break is given by
(A.3)that
is obtained for
ϵs−1 ≫ 2ss/σ0n0.
Thus, in this regime the spectral break is given by
 (A.4)
(A.4)
All Tables
All Figures
|
Fig. 1 Top panel: critical compactness ℓγ,cr as a function of the minimum energy of the γ-ray spectrum ϵmin for Γ = 1.6 (solid line) and Γ = 2 (dashed line). The numerically derived values for the two cases are shown with circles and triangles, respectively. Bottom panel: same as in top panel except for different photon indices, which are marked on the plot. Other parameters used are: ϵmax = 2.3 × 10⁵ (in mec2 units), B = 40 G, and R = 3 × 1016 cm. In both panels the grey area denotes the region where ϵmin > ϵq; see text for the definition of ϵq. |
| In the text | |
|
Fig. 2 Analytical solution of steady-state spontaneously quenched γ-ray spectra for different values of the injection parameter Q0 starting from 1.25 × 10⁻³. Each value is increased by a factor of 5 over its previous value. Crosses denote in each case the value of ϵ⋆. Other parameters used are: Γ = 2, ϵmin = 33, ϵmax = 2.3 × 10⁵, B = 40 G, and R = 3 × 1016 cm. The break energy is then ϵbr = 160. |
| In the text | |
|
Fig. 3 Numerical (dashed lines) and analytical (solid lines) solutions for the steady-state γ-ray spectra. The injection rate increases from bottom to top starting from Q0 = 1.25 × 10⁻³. The parameters used are the same as in Fig. 2. |
| In the text | |
|
Fig. 4 Log–log diagram of the critical γ-ray compactness as a function of ϵmin for constant ϵmax = 2.3 × 10⁵ (top panel) and as a function of ϵmax for constant ϵmin = 1.4 × 10⁵ (bottom panel) for three photon indices marked on the plot. Other parameters used are B = 40 G and R = 3 × 1016 cm. |
| In the text | |
|
Fig. 5 Top panel: comparison between two limiting cases where
γ-ray photons are absorbed only on synchrotron photons emitted by
secondary pairs (solid line) or by primary electrons (dashed line). The injection
compactnesses of γ-rays and primary electrons are
|
| In the text | |
|
Fig. 6 Photon index of the TeV spectrum versus the one of the GeV spectrum for several γ-ray emitting blazars. |
| In the text | |
|
Fig. 7 Plot of photon compactness as a function of time for various components. Absorbed and unabsorbed γ-rays are plotted with solid and dashed lines, respectively, while soft photons are shown with a dotted line. Parameters used for this plot: ϵmax = 2.3 × 10⁵, ϵmin = 23, Γ = 1.5, B = 40 G, R = 3 × 1016 cm, ℓinj = 1.7 × 10⁻³ ≳ ℓγ,cr, G = 10, and τc = 20. |
| In the text | |
|
Fig. 8 Snapshots of MW spectra obtained for a variable γ-ray injection compactness. The type of variation and the parameter values are the same as in Fig. 7. The arrow shows the so-called hard-to-soft evolution of the γ-ray spectrum break energy. |
| In the text | |
|
Fig. 9 Multiwavelength spectrum of PKS 0447-439 during the period November 2009–January 2010. Filled squares represent the Swift/UVOT, Swift/XRT, Fermi, and H.E.S.S. data from low to high energies respectively. Solid and dashed lines show the SEDs with and without the injection of primary electrons. Our model SEDs are corrected for EBL absorption asumming z = 0.2 and using model C of Finke et al. (2010). |
| In the text | |
Current usage metrics show cumulative count of Article Views (full-text article views including HTML views, PDF and ePub downloads, according to the available data) and Abstracts Views on Vision4Press platform.
Data correspond to usage on the plateform after 2015. The current usage metrics is available 48-96 hours after online publication and is updated daily on week days.
Initial download of the metrics may take a while.