Fig. 9
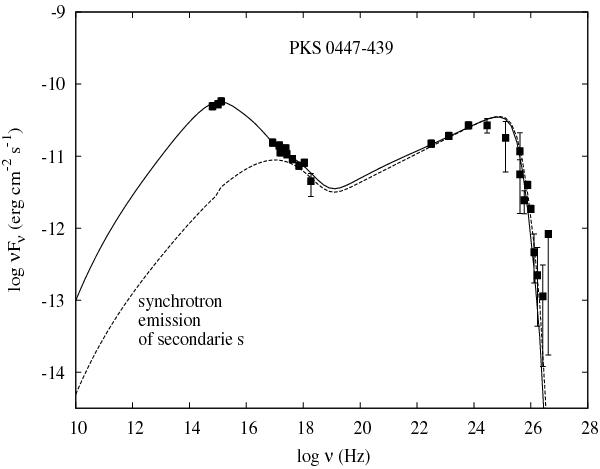
Multiwavelength spectrum of PKS 0447-439 during the period November 2009–January 2010. Filled squares represent the Swift/UVOT, Swift/XRT, Fermi, and H.E.S.S. data from low to high energies respectively. Solid and dashed lines show the SEDs with and without the injection of primary electrons. Our model SEDs are corrected for EBL absorption asumming z = 0.2 and using model C of Finke et al. (2010).
Current usage metrics show cumulative count of Article Views (full-text article views including HTML views, PDF and ePub downloads, according to the available data) and Abstracts Views on Vision4Press platform.
Data correspond to usage on the plateform after 2015. The current usage metrics is available 48-96 hours after online publication and is updated daily on week days.
Initial download of the metrics may take a while.