Fig. 1
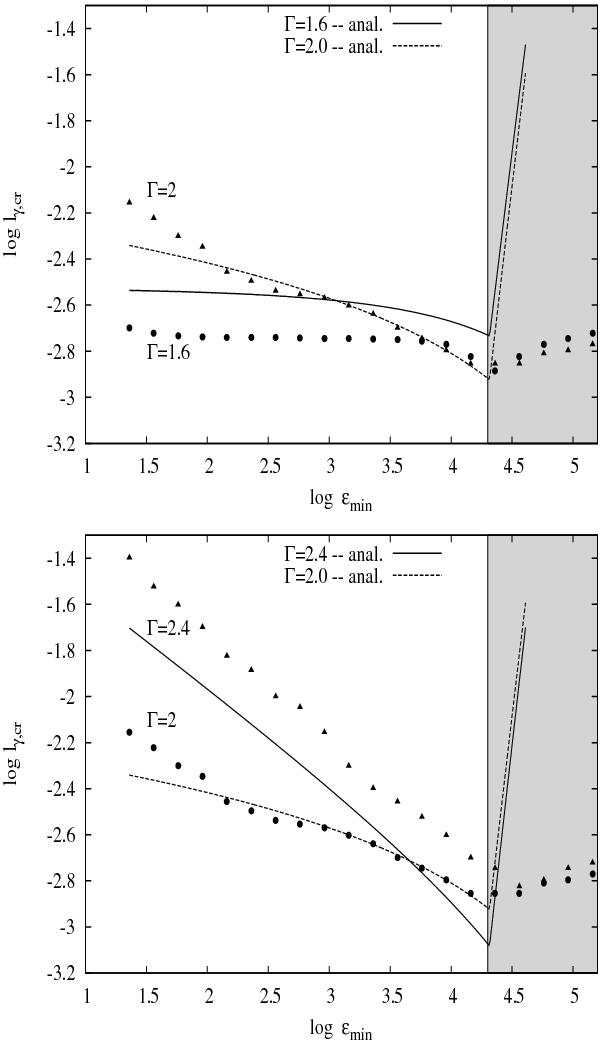
Top panel: critical compactness ℓγ,cr as a function of the minimum energy of the γ-ray spectrum ϵmin for Γ = 1.6 (solid line) and Γ = 2 (dashed line). The numerically derived values for the two cases are shown with circles and triangles, respectively. Bottom panel: same as in top panel except for different photon indices, which are marked on the plot. Other parameters used are: ϵmax = 2.3 × 10⁵ (in mec2 units), B = 40 G, and R = 3 × 1016 cm. In both panels the grey area denotes the region where ϵmin > ϵq; see text for the definition of ϵq.
Current usage metrics show cumulative count of Article Views (full-text article views including HTML views, PDF and ePub downloads, according to the available data) and Abstracts Views on Vision4Press platform.
Data correspond to usage on the plateform after 2015. The current usage metrics is available 48-96 hours after online publication and is updated daily on week days.
Initial download of the metrics may take a while.