Free Access
Fig. 3
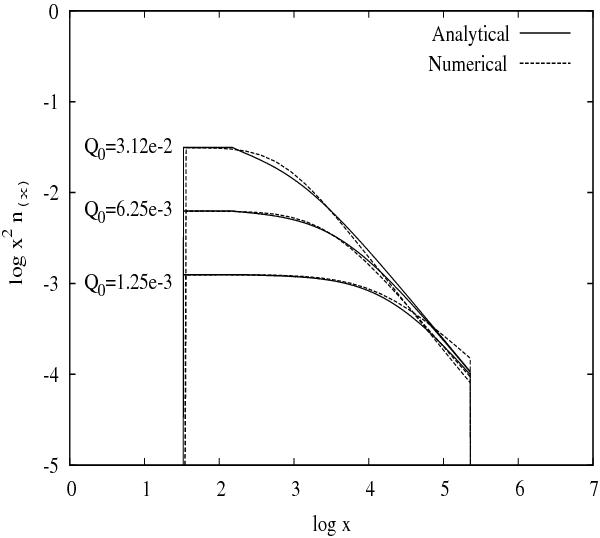
Numerical (dashed lines) and analytical (solid lines) solutions for the steady-state γ-ray spectra. The injection rate increases from bottom to top starting from Q0 = 1.25 × 10⁻³. The parameters used are the same as in Fig. 2.
Current usage metrics show cumulative count of Article Views (full-text article views including HTML views, PDF and ePub downloads, according to the available data) and Abstracts Views on Vision4Press platform.
Data correspond to usage on the plateform after 2015. The current usage metrics is available 48-96 hours after online publication and is updated daily on week days.
Initial download of the metrics may take a while.