Free Access
Fig. 9
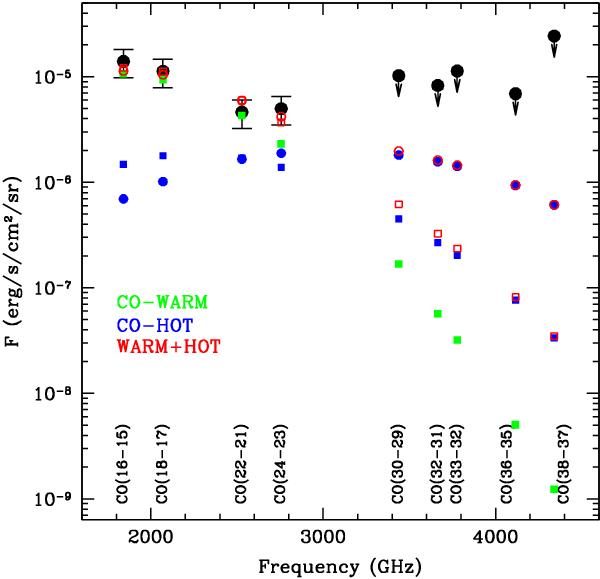
Same comparison presented in Fig. 6, but for the CO fluxes measured with PACS toward L1448-B2 (both the detections and the non-detections). The two blue models represent the extremes of the density range derived from the H2O excitation analysis.
Current usage metrics show cumulative count of Article Views (full-text article views including HTML views, PDF and ePub downloads, according to the available data) and Abstracts Views on Vision4Press platform.
Data correspond to usage on the plateform after 2015. The current usage metrics is available 48-96 hours after online publication and is updated daily on week days.
Initial download of the metrics may take a while.