Fig. 8
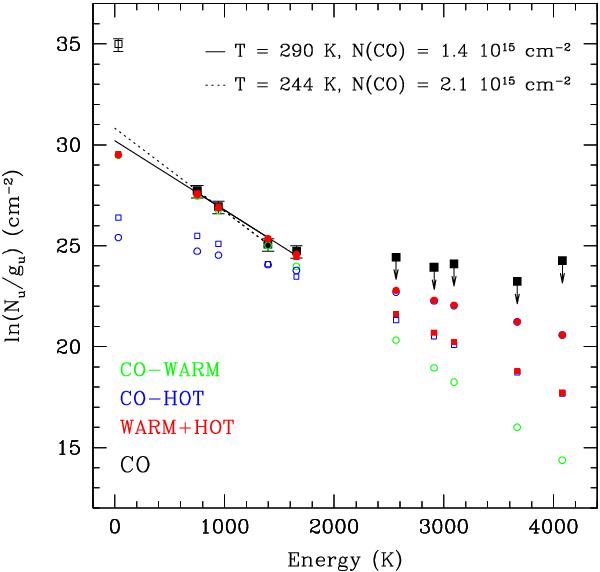
Rotational diagram at L1448-B2 for the CO emission lines (both the detections and the non-detections) observed with PACS (in a 12.′′6 beam) and the JCMT CO(3 − 2) line (empty symbol; beam size equal to 14′′). Calibration uncertainties of 30% have been assumed. The solid line represents the linear fit to the four detected CO lines, the dotted line the linear fit only to the three lower excitation CO lines. As in Fig. 7, the predictions of the two best-fit models for L1448-B2 corrected for the relative predicted filling factors are shown.
Current usage metrics show cumulative count of Article Views (full-text article views including HTML views, PDF and ePub downloads, according to the available data) and Abstracts Views on Vision4Press platform.
Data correspond to usage on the plateform after 2015. The current usage metrics is available 48-96 hours after online publication and is updated daily on week days.
Initial download of the metrics may take a while.