Fig. 5
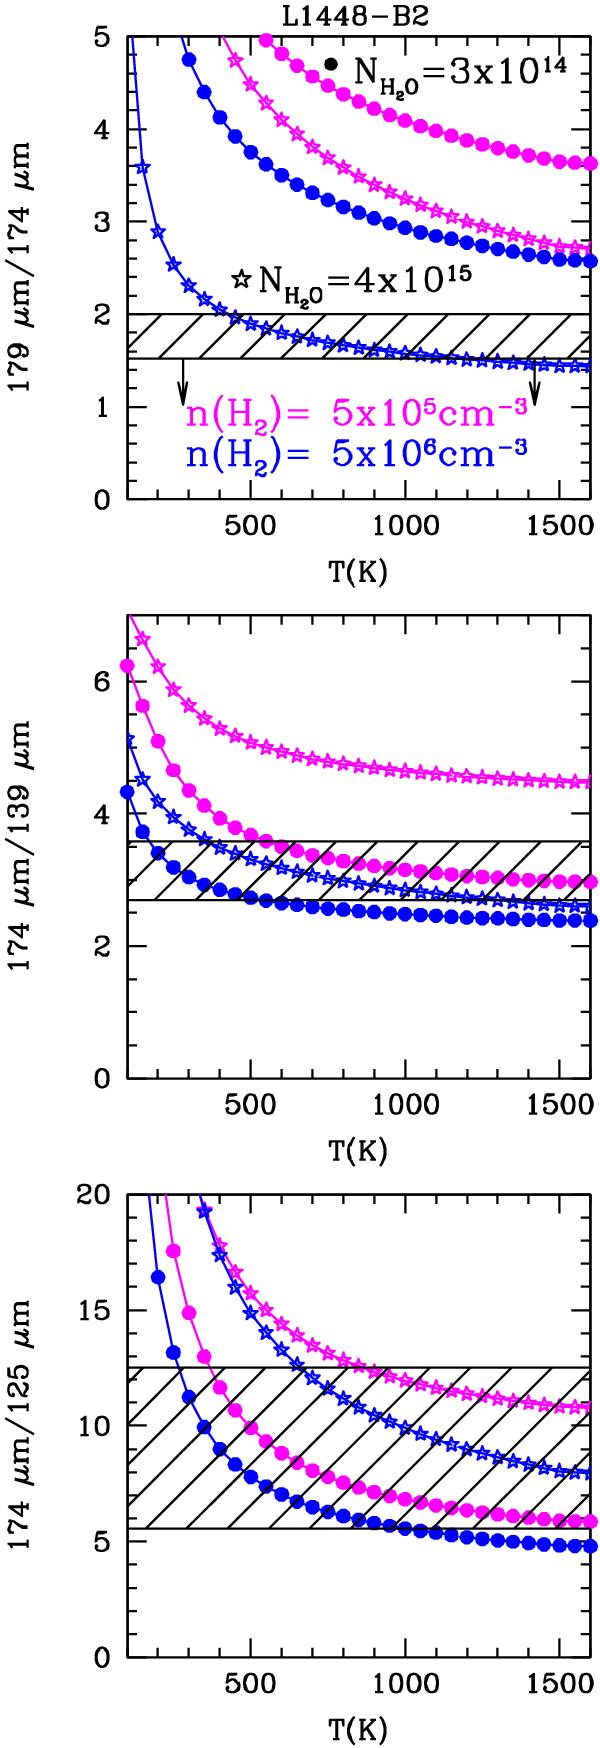
Top: ratio between H2O 212 − 101 (179 μm) and 303 − 212 (174 μm) emission, as a function of T for two values of H2 density (nH2 = 5 × 105 cm-3 and 5 × 106 cm-3) and two values of H2O column density (NH2O = 3 × 10¹⁴ and 4 × 1015 cm-2) of L1448-B2. The shaded band highlights the H2O ratio observed with PACS and the arrows indicate that this ratio can be considered an upper limit (see text for details). Middle and bottom: ratios between H2O 303 − 212 (174 μm) and 313 − 202 (138.5 μm) emission and between H2O 303 − 212 (174 μm) and 404 − 313 (125.4 μm) emission, respectively, as a function of T. The symbols are the same as in the top panel.
Current usage metrics show cumulative count of Article Views (full-text article views including HTML views, PDF and ePub downloads, according to the available data) and Abstracts Views on Vision4Press platform.
Data correspond to usage on the plateform after 2015. The current usage metrics is available 48-96 hours after online publication and is updated daily on week days.
Initial download of the metrics may take a while.