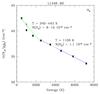
Fig. 4
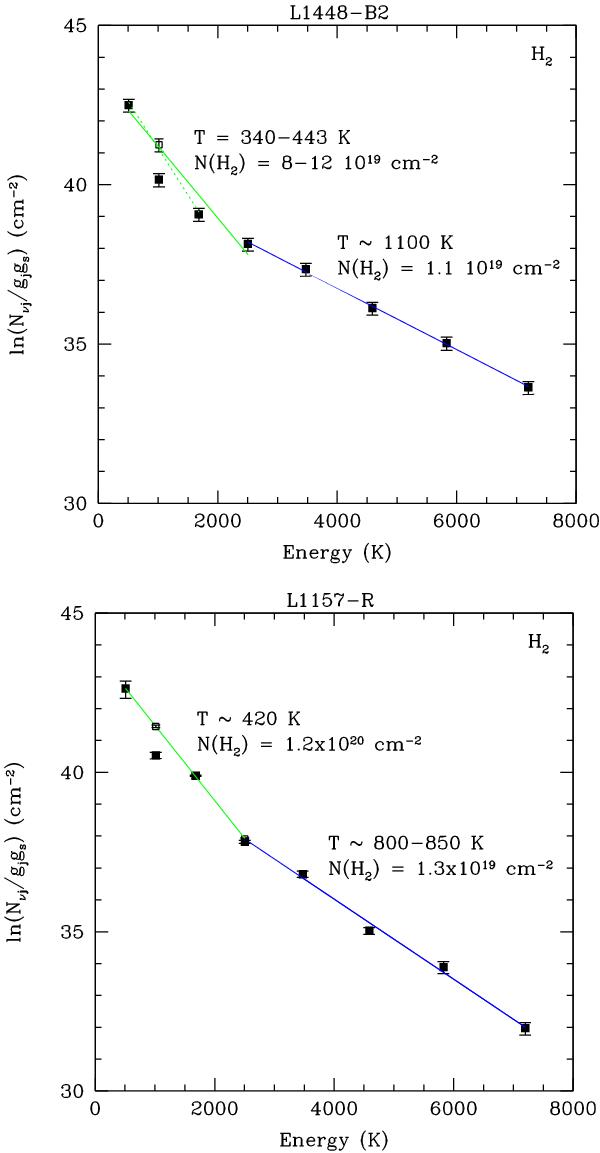
Upper: rotational diagram at L1448-B2 for the H2 emission lines detected with Spitzer by Giannini et al. (2011). The values have been derived from the H2 fluxes integrated over a 13′′ area for comparison with the PACS data. The black dots are the observed values, whereas the empty dot represents the H2 S(1) line corrected for an ortho-to-para ratio equal to 1 (see Giannini et al. 2011). The green solid line represents the linear fit to the S(0)–S(3) H2 lines, while the green dotted line is the fit obtained using the S(0)–S(2) H2 lines. Finally, the blue line is the linear fit to the S(3)–S(7) lines. The resulting parameters (T,N) or range of parameters of the linear fits are reported in the diagram. Lower: H2 rotational diagram at L1157-R. The symbols are the same as in the upper panel.
Current usage metrics show cumulative count of Article Views (full-text article views including HTML views, PDF and ePub downloads, according to the available data) and Abstracts Views on Vision4Press platform.
Data correspond to usage on the plateform after 2015. The current usage metrics is available 48-96 hours after online publication and is updated daily on week days.
Initial download of the metrics may take a while.