Fig. 3
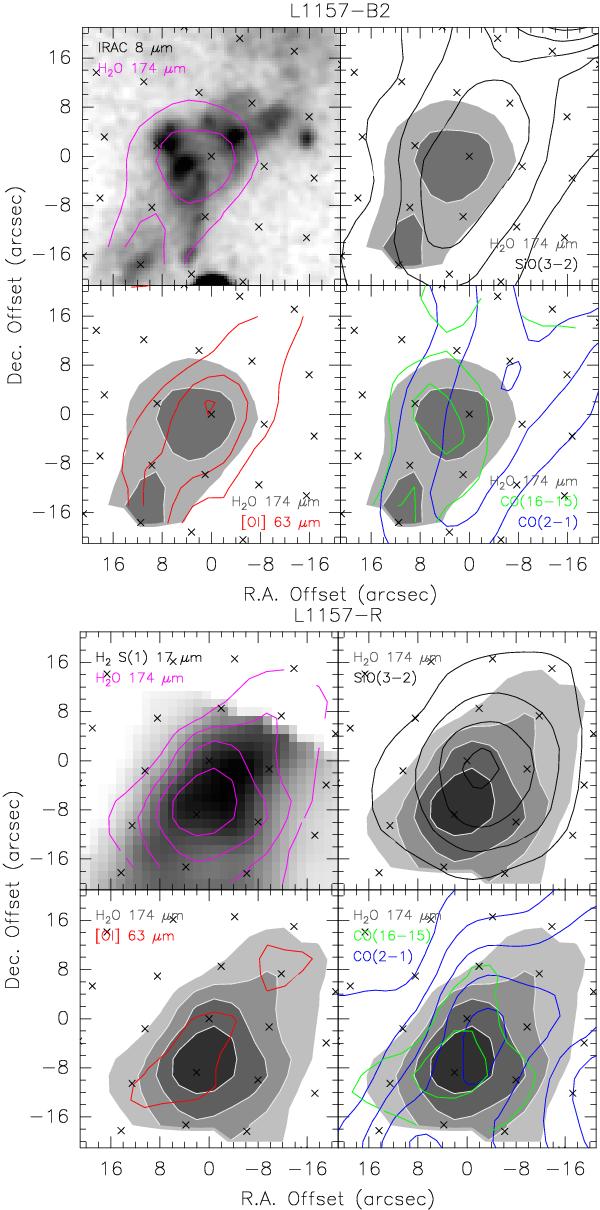
Same as in Fig. 2, but for the L1157 outflow. Contours are displayed for IRAM-30 m CO(2 − 1) and SiO(3 − 2) emission (HPBW equal to 11′′ and 18′′, respectively) from Bachiller et al. (2001) and are traced in steps of 5σ, starting from 5σ. Spitzer-IRAC 8 μm emission and Spitzer-IRS H2 S(1) emission at 17 μm from Neufeld et al. (2009) are shown.
Current usage metrics show cumulative count of Article Views (full-text article views including HTML views, PDF and ePub downloads, according to the available data) and Abstracts Views on Vision4Press platform.
Data correspond to usage on the plateform after 2015. The current usage metrics is available 48-96 hours after online publication and is updated daily on week days.
Initial download of the metrics may take a while.