Fig. 2
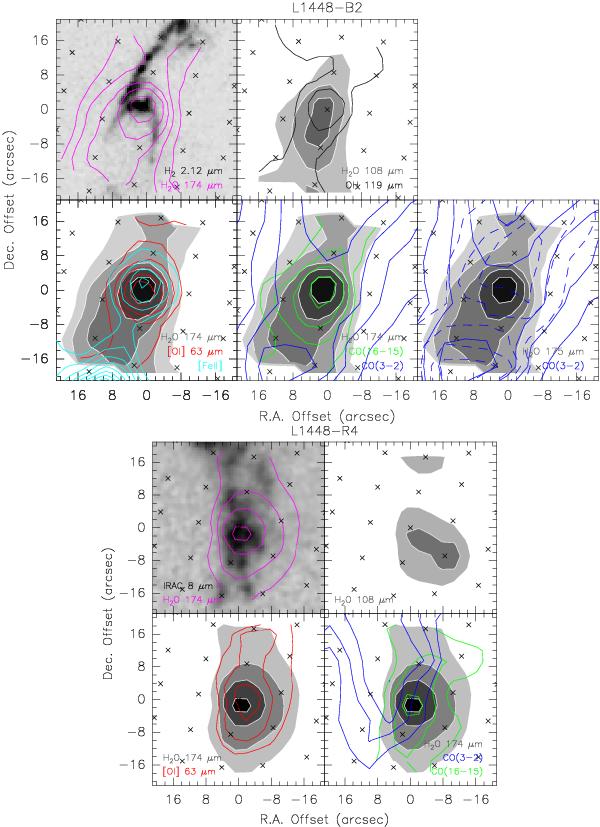
Overlay between PACS H2O 303 − 212 (174 μm), H2O 221 − 110 (108.1 μm), [Oi]  (63.2 μm), CO(16 − 15), OH (119 μm), and other tracers in the B2 (upper panel) and R4 (lower panel) shocked spots along the L1448 outflow. In particular, JCMT CO(3 − 2) emission (Half Power Beam Width, HPBW ~ 14′′) from Nisini et al. (2013), Spitzer [Feii] emission at 26 μm from Neufeld et al. (2009), IRAC 8 μm emission from Tobin et al. (2007), and H2 emission at 2.12 μm from Davis & Smith (1995) are shown. In the bottom-right panel relative to L1448-B2 the EHV CO(3 − 2) emission (v ≳ − 50 km s-1) and the HV CO(3 − 2) emission (v ≲ − 40 km s-1) are shown in dashed and solid lines, respectively. The contours in each map are traced every 3σ, starting from a 5σ level, except for the CO(3 − 2) in L1448-B2, where the contours are traced in steps of 5σ, starting from 5σ. The crosses represent the pointing of the 25 spaxels.
Current usage metrics show cumulative count of Article Views (full-text article views including HTML views, PDF and ePub downloads, according to the available data) and Abstracts Views on Vision4Press platform.
Data correspond to usage on the plateform after 2015. The current usage metrics is available 48-96 hours after online publication and is updated daily on week days.
Initial download of the metrics may take a while.