Fig. 13
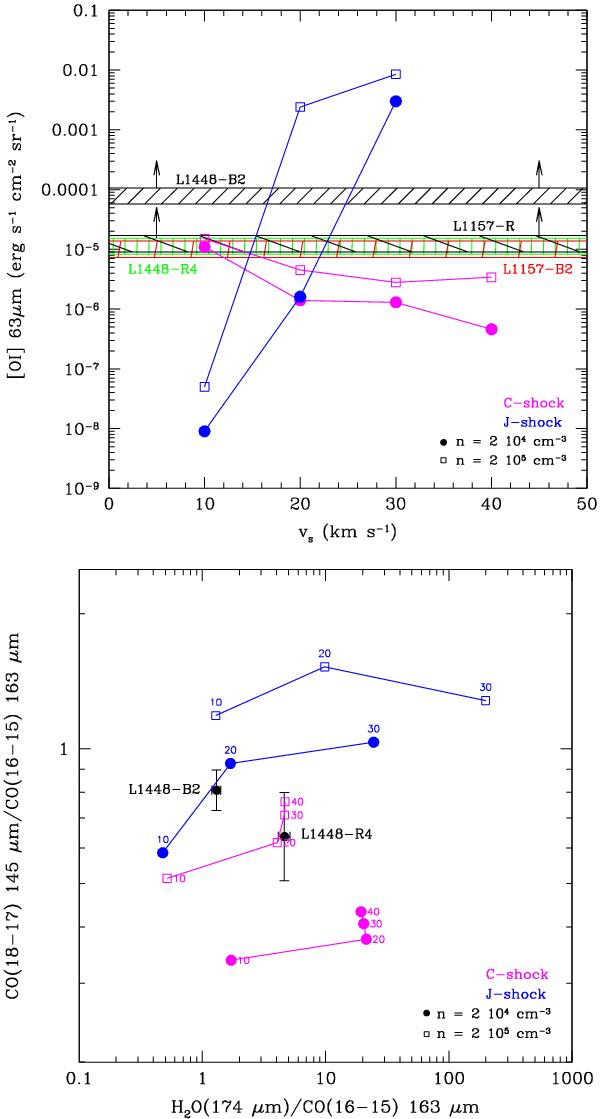
Upper panel: comparison between the [Oi]  (63.2 μm) flux observed at the investigated shock positions (shaded bands) and the corresponding theoretical values predicted by the Flower & Pineau Des Forêts (2010) shock models for C-type shocks (magenta) and J-type shocks (blue), as a function of the shock velocity in units of km s-1. The fluxes measured in the central spaxel of the PACS maps have been used without smoothing to a common angular resolution. Calibration uncertainties of 30% have been assumed. The arrows in the plot indicate that the absolute fluxes have to be considered as lower limits; they are beam diluted because we do not resolve the emitting size of the shock. Lower panel: same comparison as in the upper panel, but for CO and H2O line ratios. The observed values are depicted as black dots and the errorbars represent 1σ errors. The data have been smoothed to a common angular resolution of 12.′′6.
Current usage metrics show cumulative count of Article Views (full-text article views including HTML views, PDF and ePub downloads, according to the available data) and Abstracts Views on Vision4Press platform.
Data correspond to usage on the plateform after 2015. The current usage metrics is available 48-96 hours after online publication and is updated daily on week days.
Initial download of the metrics may take a while.