Fig. 12
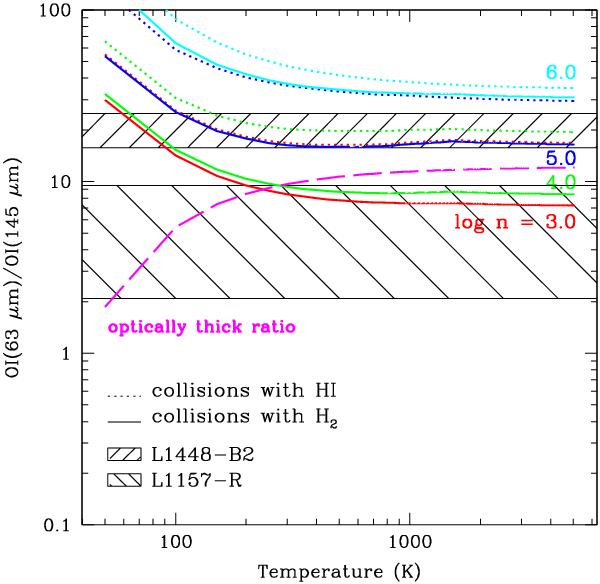
Optically thin [Oi]63 μm/[Oi]145 μm flux ratios as a function of temperature are shown in dotted lines for collisions with atomic hydrogen H and in solid lines for collisions with molecular hydrogen H2 (as in Liseau et al. 2006). The logarithms of the density (in cm-3) are indicated for each curve. The broken line outlines the ratio of optically thick lines. Observed line ratios are depicted by the shaded areas for the L1448-B2 position and the L1157-R position. The data have been smoothed to a common angular resolution of 12.′′6.
Current usage metrics show cumulative count of Article Views (full-text article views including HTML views, PDF and ePub downloads, according to the available data) and Abstracts Views on Vision4Press platform.
Data correspond to usage on the plateform after 2015. The current usage metrics is available 48-96 hours after online publication and is updated daily on week days.
Initial download of the metrics may take a while.