Fig. B.1
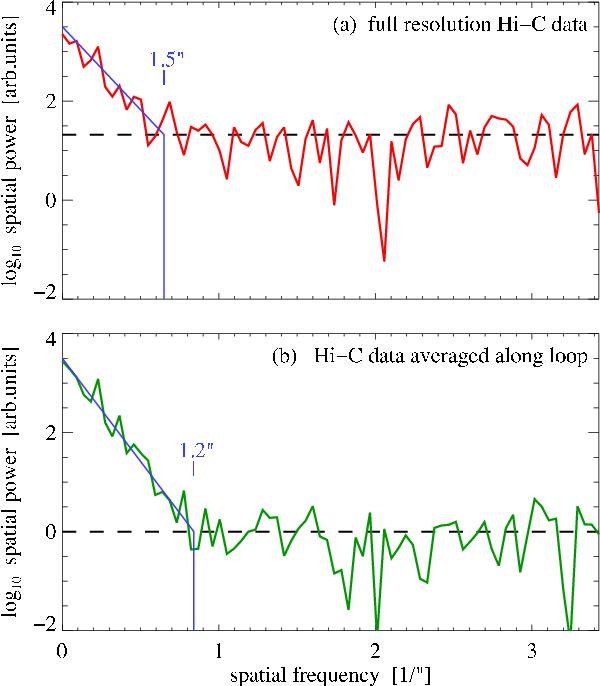
Size of the loop structures in Hi-C. Shown are the power spectra of the cross-sectional cuts of the loops in Fig. 6, for the original data (top panel, red here and in Fig. 6) and the data averaged over 21 pixels along the loop (bottom panel green here and in Fig. 6). The horizontal dashed lines shows the noise level (21 in top panel, 1 in bottom panel). The diagonal blue line is a by-eye fit to the power spectrum at low spatial frequencies, the vertical line indicated the intersection of this fit with the respective noise level. The numbers in the panels give the corresponding spatial scale. See Appendix B.
Current usage metrics show cumulative count of Article Views (full-text article views including HTML views, PDF and ePub downloads, according to the available data) and Abstracts Views on Vision4Press platform.
Data correspond to usage on the plateform after 2015. The current usage metrics is available 48-96 hours after online publication and is updated daily on week days.
Initial download of the metrics may take a while.