Fig. 8
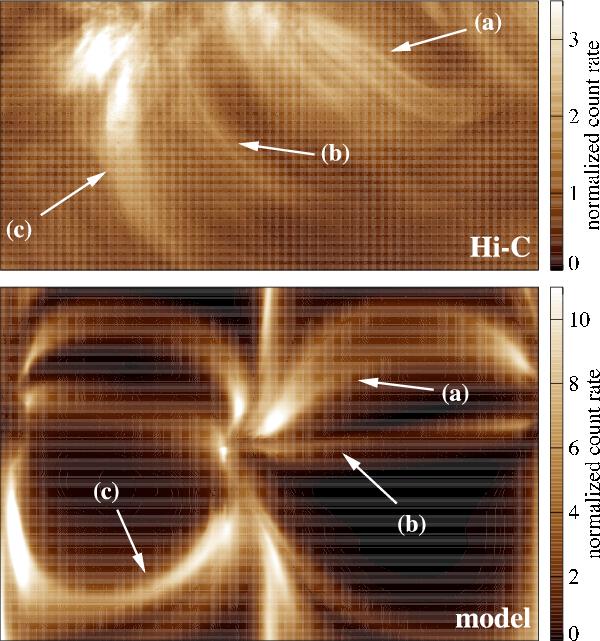
Morphological comparison of observation and model. The top panel shows the actual observation of Hi-C (193 Å band). The field of view (124′′ × 62′′) is outlined in Fig. 1 by the dashed rectangle. The bottom panel shows the coronal emission as synthesized from a 3D MHD model for this channel (165 × 109 Mm). The arrows point to features that can be found in both model and observations: a) expanding envelope that consists of several non-expanding loops; b) thin non-expanding threads; and c) rather broad loop-like structures with approximately constant cross section. See Sect. 4.
Current usage metrics show cumulative count of Article Views (full-text article views including HTML views, PDF and ePub downloads, according to the available data) and Abstracts Views on Vision4Press platform.
Data correspond to usage on the plateform after 2015. The current usage metrics is available 48-96 hours after online publication and is updated daily on week days.
Initial download of the metrics may take a while.