Free Access
Fig. 6
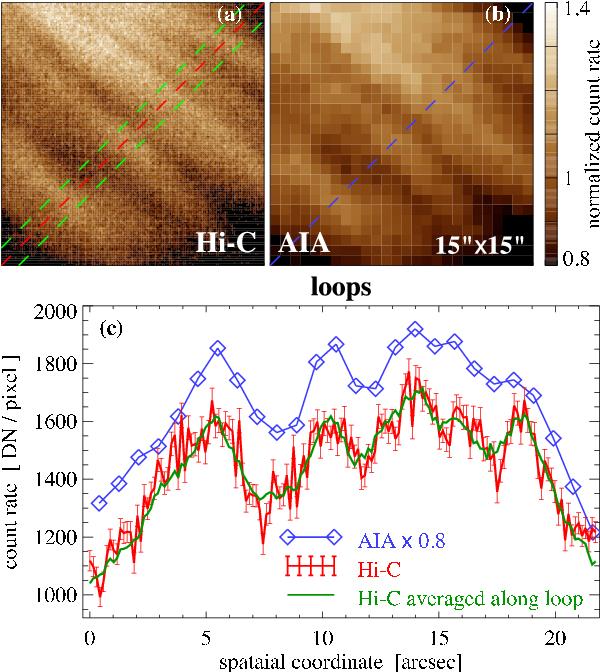
Zoom of the loop region indicated in Fig. 3 by a square. Otherwise this is the same as Fig. 4. In addition, here the green line shows the cross-sectional cut averaged over 3′′ along the loops; i.e., it shows the average variation in the band defined by the two green lines in panel a). See Sect. 3.2.
Current usage metrics show cumulative count of Article Views (full-text article views including HTML views, PDF and ePub downloads, according to the available data) and Abstracts Views on Vision4Press platform.
Data correspond to usage on the plateform after 2015. The current usage metrics is available 48-96 hours after online publication and is updated daily on week days.
Initial download of the metrics may take a while.