Fig. 5
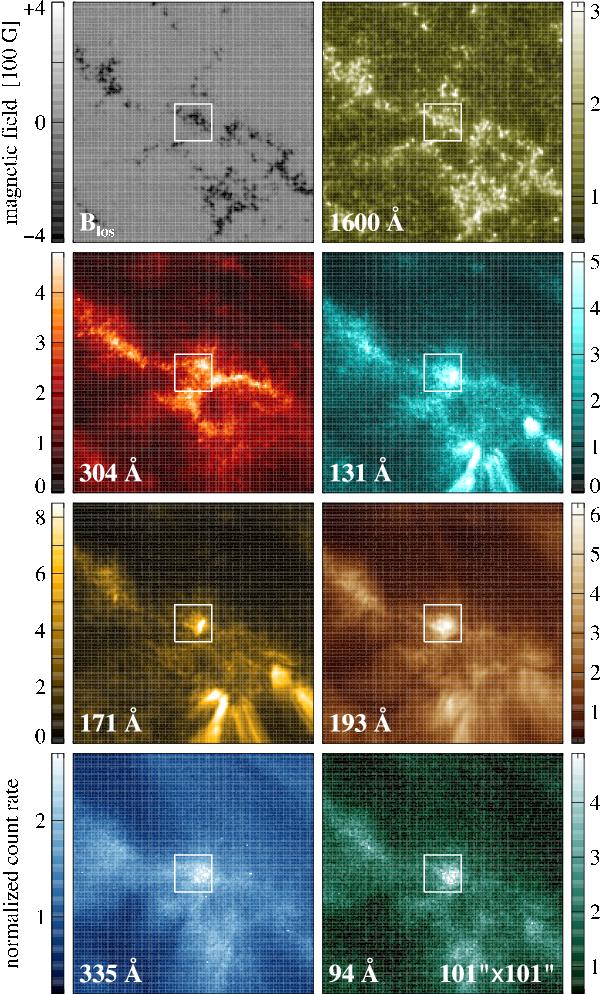
Context of the plage region shown in Fig. 4. The AIA images in 7 channels show a 101′′ × 101′′ region and are taken within seconds of the 193 Å Hi-C image. The squares indicate the field-of-view shown in Fig. 4 and are co-spatial with the small squares in Fig. 3 labeled “plage”. In Fig. 4 the 193 Å images of Hi-C and AIA zooming into the small square are shown. Only there can the miniature loop be identifies in the Hi-C image. The top left panel shows the co-spatial line-of-sight magnetogram in the photosphere as seen by HMI, taken within seconds of the other images. See Sect. 3.1.
Current usage metrics show cumulative count of Article Views (full-text article views including HTML views, PDF and ePub downloads, according to the available data) and Abstracts Views on Vision4Press platform.
Data correspond to usage on the plateform after 2015. The current usage metrics is available 48-96 hours after online publication and is updated daily on week days.
Initial download of the metrics may take a while.