Fig. 4
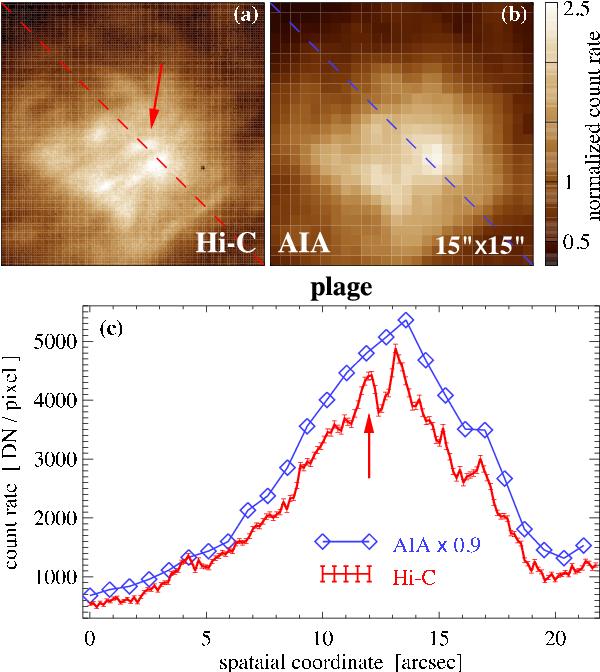
Zoom of the plage region indicated in Fig. 3 by a square. The top two panels show the Hi-C image (150 × 150 pixel) and the AIA image (26 × 26 pixel) in that 15′′ × 15′′ region. The individual pixels are clearly identifiable in the AIA image. The bottom panel shows the variation in the count rate across the structures along the diagonal indicated by the dashed lines in the top panels. The pixels for the AIA data are indicated by diamonds. The bars indicate the individual pixels of Hi-C, the height of the bars represent the errors. For better comparison the AIA count rate is scaled by the factor given in the plot. The arrows in panels a) and c) indicate the position of a miniature coronal loop. See Sect. 3.1
Current usage metrics show cumulative count of Article Views (full-text article views including HTML views, PDF and ePub downloads, according to the available data) and Abstracts Views on Vision4Press platform.
Data correspond to usage on the plateform after 2015. The current usage metrics is available 48-96 hours after online publication and is updated daily on week days.
Initial download of the metrics may take a while.