Fig. 1
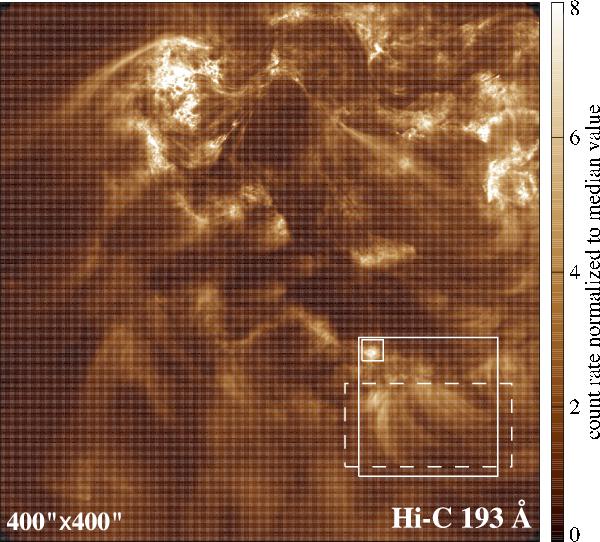
Full field-of-view of the Hi-C observations. This image is taken in a wavelength band around 193 Å that under active region conditions is dominated by emission from Fe xii formed at around 1.5 MK. The core of the active region with several sunspots is located in the top half of the image (cf. Fig. 2). Here we concentrate on the loop system in the bottom right at the periphery of the active region. The regions indicated by the large solid square and the dashed rectangle are shown in Figs. 3 and 8. The small square shows the plage areas zoomed-in in Fig. 4. Here as in the following figures, the count rate is plotted normalized to the median value in the respective field-of-view. North is top.
Current usage metrics show cumulative count of Article Views (full-text article views including HTML views, PDF and ePub downloads, according to the available data) and Abstracts Views on Vision4Press platform.
Data correspond to usage on the plateform after 2015. The current usage metrics is available 48-96 hours after online publication and is updated daily on week days.
Initial download of the metrics may take a while.