Free Access
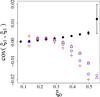
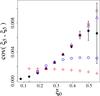
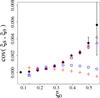
Fig. B.2
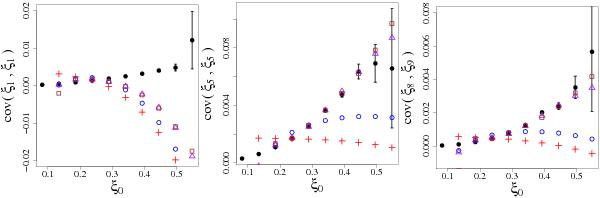
Different elements of the covariance matrix C({ ξn }), determined from simulations (black points with error bars) and analytically to zeroth (red crosses), first (blue circles), fifth (purple triangles), and tenth (brown squares) order.
This figure is made of several images, please see below:
Current usage metrics show cumulative count of Article Views (full-text article views including HTML views, PDF and ePub downloads, according to the available data) and Abstracts Views on Vision4Press platform.
Data correspond to usage on the plateform after 2015. The current usage metrics is available 48-96 hours after online publication and is updated daily on week days.
Initial download of the metrics may take a while.