Free Access
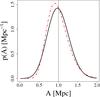
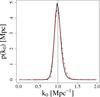
Fig. 11

Marginalized posterior probabilities for the power spectrum parameters A and k0. The solid black curves are the results obtained from the Gaussian likelihood, whereas the red dot-dashed curves show the results from the quasi-Gaussian analysis.
This figure is made of several images, please see below:
Current usage metrics show cumulative count of Article Views (full-text article views including HTML views, PDF and ePub downloads, according to the available data) and Abstracts Views on Vision4Press platform.
Data correspond to usage on the plateform after 2015. The current usage metrics is available 48-96 hours after online publication and is updated daily on week days.
Initial download of the metrics may take a while.