Free Access
Fig. 2
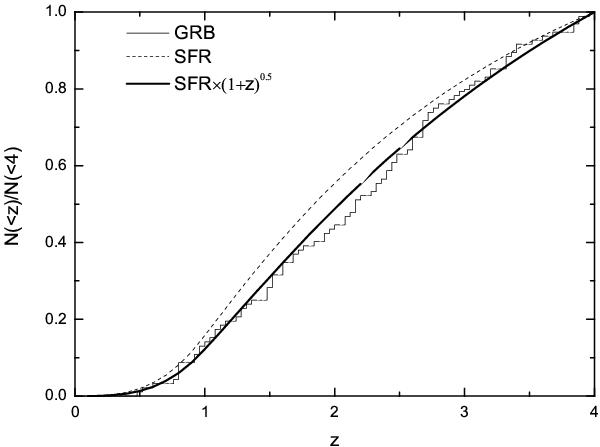
Cumulative distribution of 92 Swift GRBs with Liso > 1051 erg s-1 in z = 0−4 (stepwise solid line). The dashed line shows the GRB rate inferred from the star formation history of Hopkins & Beacom (2006). The solid line shows the GRB rate inferred from the star formation history including (1 + z)0.5 evolution.
Current usage metrics show cumulative count of Article Views (full-text article views including HTML views, PDF and ePub downloads, according to the available data) and Abstracts Views on Vision4Press platform.
Data correspond to usage on the plateform after 2015. The current usage metrics is available 48-96 hours after online publication and is updated daily on week days.
Initial download of the metrics may take a while.