| Issue |
A&A
Volume 556, August 2013
|
|
|---|---|---|
| Article Number | A47 | |
| Number of page(s) | 31 | |
| Section | Extragalactic astronomy | |
| DOI | https://doi.org/10.1051/0004-6361/201321563 | |
| Published online | 23 July 2013 | |
X-ray spectral variability of seven LINER nuclei with XMM-Newton and Chandra data⋆
1
Instituto de Astrofísica de Andalucía, CSIC,
Glorieta de la Astronomía,
s/n,
18008
Granada,
Spain
e-mail:
This email address is being protected from spambots. You need JavaScript enabled to view it.
2
Instituto de Astrofísica de Canarias (IAC),
C/Vía Lactea, s/n, 38205 La
Laguna, Tenerife,
Spain
3
Departamento de Astrofísica, Universidad de La Laguna
(ULL), 38205, La
Laguna, Tenerife,
Spain
Received:
25
March
2013
Accepted:
9
May
2013
Abstract
Context. One of the most distinctive features in active galactic nuclei (AGN) is the variability of their emission. Variability has been discovered at X-ray, UV, and radio frequencies on timescales from hours to years. Among the AGN family and according to theoretical studies, low-ionization nuclear emission line region (LINER) nuclei would be objects variable on long timescales.
Aims. Our purpose is to investigate spectral X-ray variability in LINERs and to understand the nature of these types of objects, as well as their accretion mechanism.
Methods. Chandra and XMM-Newton public archives were used to compile X-ray spectra of seven LINER nuclei at different epochs with timescales of years. To search for variability we fit all spectra from the same object with a set of models to identify the parameters responsible for the variability pattern. We also analyzed the light curves to search for short timescale (from hours to days) variability. Whenever possible, UV variability was also studied.
Results. We found spectral variability in four objects (NGC 1052, NGC 3226, NGC 4278, and NGC 4552), with variations mostly related to hard energies (2–10 keV). These variations are generated by several possible changes that act either alone or in combination: changes in the soft excess or in the absorber. Added to this can be intrinsic variations of the source, which may also be responsible by themselves for the spectral variability. These variations occurred within years, the shortest timescale being found for NGC 4278 (two months). Another two galaxies (NGC 4261 and NGC 5846) apparently do not vary. No short timescale variations during individual observations were found. Our analysis confirms the previously reported anticorrelation between the X-ray spectral index, Γ, and the Eddington ratio, Lbol/LEdd, and also the correlation between the X-ray to UV flux ratio, αox, and the Eddington ratio, Lbol/LEdd. These results support an advection dominated accretion flow as the accretion mechanism in LINERs.
Key words: galaxies: active / X-rays: galaxies / ultraviolet: galaxies
Tables 2–11 and Appendices are available in electronic form at http://www.aanda.org
© ESO, 2013
1. Introduction
The plethora of phenomena present in an active galactic nucleus (AGN) shows energetic processes in the nuclei of galaxies that cannot be attributed to stars (Peterson 1997). The unified model for AGN (Urry & Padovani 1995; Antonucci 1993) represents a scenario where the central, supermassive black hole (SMBH) is surrounded by a dusty torus; depending on the line of sight of the observer, the AGN appears as type 1 (pole-on view) or type 2 (edge on view). However, even if, broadly speaking, the unified model is a good representation of AGN, there are a number of objects that still cannot be fitted with this scheme. This is the case of low-ionization nuclear emission line regions (LINERs), which are the main topic of this research.
First defined by Heckman (1980), LINERs were characterized in the optical, where their spectra show strong low-ionization lines such as [OI] λ 6300 Å and [SII] λλ 6717, and 6731 Å (Veilleux & Osterbrock 1987). Different options have been proposed to explain the ionization mechanism in LINERs, such as shock-heated gas (Dopita & Sutherland 1995), photoionization by hot stars (Terlevich & Melnick 1985), by post-main-sequence stars (Cid-Fernandes et al. 2011), or a low-luminosity active galactic nuclei (LLAGN, Ho et al. 1993). Currently, the most accepted option is that they harbor AGN (see Ho 2008; Márquez 2012).
X-ray data for LLAGN offer the most reliable probe of the high-energy spectrum, providing many AGN signatures (D’Onofrio et al. 2012). It can be assessed that an AGN is present in LINERs when a point-like source is detected at hard X-ray energies (Satyapal et al. 2004, 2005; Dudik et al. 2005; Ho 2008). The most extensive work has been carried out by González-Martín et al. (2009b), who analyzed 82 LINERs with Chandra and/or XMM-Newton data for single-period observations. These authors found that 60% of the sample showed a compact nuclear source in the 4.5–8 keV band; a multiwavelength analysis found that about 80% of the sample showed evidence of AGN-related properties, which is a lower limit because Compton-thick objects were not taken into account.
It is tempting to view LINERs as a scaled-down version of Seyfert galaxies, but in fact they are qualitatively different from their neighboring class (Ho 2008). LINERs have lower luminosities (L2−10 keV ≈ 1039−1042 erg s-1), lower Eddington ratios (Lbol/LEdd ≈ 10-4), and more massive black holes (MBH ≈ 108 M⊙, Eracleous 2010; Masegosa et al. 2011).
Variability is one of the main properties that characterizes AGN, most of which are at least mildly variable. When quasars were first discovered in the 1960s (Schmidt 1963), one of their key defining properties was their variability. These objects are variable over the entire wavelength range, many of them varying by 0.3–0.5 mag over timescales of a few months, and others varying significantly on timescales as short as a few days (Peterson 1997). Variability properties seem to correlate with AGN power; in quasars, variations very likely result from both accretion disk instability and microlensing, while in Seyfert galaxies the brightness of the nucleus is thought to vary, the broad-line region (BLR) responding to these changes a few weeks later (D’Onofrio et al. 2012).
At X-ray frequencies many studies have been made with the aim of understanding variability in Seyfert galaxies. Risaliti et al. (2000) studied the highly variable Seyfert 1.8 galaxy NGC 1365, which was observed for many years with different instruments; they also found variability in the Seyfert galaxy UGC 4203 using Chandra data (Risaliti et al. 2010). They suggested a scenario in which the variability is produced by clouds intersecting the line of sight to the observer. Evans et al. (2005) found that the 2–10 keV luminosity for NGC 6251 varied a factor of ≈5 from 1991 to 2003. More recently, Caballero-Garcia et al. (2012) showed that the five Seyfert galaxies studied with Swift/BAT showed flux variability on timescales of 1–2 days. Narrow-line Seyfert 1 galaxies (NLSy1) also show variability in X-rays (Panessa et al. 2011; Risaliti et al. 2011).
As stated by Ptak et al. (1998), “LINERs tend to show little or no significant short-term variability (i.e., with timescales less than a day)” (see also Krolik 1999). The first clear evidence of variability in LINERs was reported by Maoz et al. (2005) at UV frequencies, where all but three objects in their sample of 17 LINERs of type 1 and 2 appeared variable. Pian et al. (2010) and Younes et al. (2011) investigated type 1 LINERs at X-ray energies and also found that variability is a common property of LINERs. González-Martín et al. (2011a) studied a Suzaku observation of 80 ks of the Compton-thick LINER NGC 4102, and found two absorbers from the soft X-rays and the optical spectrum. They found variations of the soft-excess flux within about seven years compared whith Chandra data. This variation was described by a decrease in the normalization of the power-law component and the thermal component by a factor of ≈7. Therefore it is important to characterize the phenomenon fully, both the scale and magnitude of the variability. Taking the predictions by McHardy et al. (2006) that the timescale variations scale with black-hole masses, MBH, and bolometric luminosities, Lbol, González-Martín & Vaughan (2012) estimated timescales longer than tens of days in LINERs.
This paper is organized as follows: in Sect. 2 we present the sample and the data. The reduction of the data is explained in Sect. 3. Our methodolody is described in Sect. 4, where individual and simultaneous spectral fittings, comparisons of different appertures, flux variability in X-rays and UV frequencies, and short-term variability subsections are explained. The results from this analysis are given in Sect. 5, and we discuss them in Sect. 6. Finally, our main results are summarized in Sect. 7.
2. Sample and data
For the sample of 82 LINERs of type 1 and 2 in González-Martín et al. (2009b) we searched in the current literature for hints of variability by means of differences in luminosity when different observations are considered. We used the HEASARC1 archive to search for different observations with Chandra and XMM-Newton, with publicly available data until October 2012. This analysis provided 16 candidate variable sources. The four ultraluminous infrared galaxies (ULIRG) in this primary selection (NGC 3690, NGC 6240, IRAS 17208-0014, and UGC 08696) were discarded since our aim is to deal with typical pure LINERs (see Ho 2008), not contaminated by strong star formation where other ionization sources could be at work. NGC 4636 was also discarded because its X-ray emission is dominated by the cluster emission. We also rejected all observations affected by pile-up higher than 10% (Chandra data observations for objects namely NGC 4579, NGC 3998, NGC 4594, and NGC 6251 and three Chandra observations of NGC 4278). Finally, to guarantee a proper spectral fitting we kept only observations with at least 400 number counts. An exception was made for obs ID 11269 of NGC 4278, which met this criterion, but visual inspection revealed a very low count number in the hard band.
The final sample of LINERs contains seven objects. Table 1 shows the general properties of the target galaxies for this study and Table 2 the log of the observations. Number of counts and hardness ratios, defined as HR = (H-S)/(H+S), where H is the number of counts in the hard (2–10 keV) band and S is the number of counts in the soft (0.5–2 keV) band, are also presented. For five sources, NGC 1052, NGC 3226, NGC 4261, NGC 4278, and NGC 5846, observations at different epochs were taken with the same instrument, providing us with good examples for variability studies. In the other two sources, NGC 3627, and NGC 4552, we can estimate variability only by comparing XMM-Newton with Chandra data. These results should be viewed with caution because of the different apertures used by both instruments. A detailed study of the extended emission is made for these two objects (see Sect. 4).
General properties of the sample galaxies.
3. Data reduction
Data reduction was performed following the procedure described by González-Martín et al. (2009b). We recall the methodology here.
3.1. Chandra data
Chandra observations were obtained with the ACIS instrument (Garmire et al. 2003). The data reduction and analysis were carried out in a systematic, uniform way using CXC Chandra Interactive Analysis of Observations (CIAO2), version 4.3. Level 2 event data were extracted by using the task acis-process-events. We first cleaned the data from background flares (i.e., periods of high background) that could affect our analysis. These “flares” are due to low-energy photons that interact with the detector. To clean them we used the task lc_clean.sl3, which removes periods of anomalously low (or high) count rates from light curves from source-free background regions of the CCD. This routine calculates a mean rate from which it deduces a minimum and maximum valid count rate, and creates a file with the periods that are considered by the algorithm to be good.
Nuclear spectra were extracted from a circular region centered on the positions given by NED4. We chose circular radii, aiming to include all possible photons, while excluding other sources or background effects. The radii are in the range between 3–8″ (or 6–16 pixels, see Table 2). The background selection was made taking regions free of sources in the same chip as the target and close to the source (5″ for NGC 3627, NGC 4278, NGC 4261, and NGC 4552, and 7″ for NGC 5846 and NGC 3627) to minimize effects related to the spatial variations of the CCD response.
We used the dmextract task to extract the spectra of the source and the background regions. The response matrix file (RMF) and ancillary reference file (ARF) were generated for each source region using the mkacisrmf and mkwarf tasks, respectively. Before background subtraction, the spectra were binned to have a minimum of 20 counts per spectral bin, to be able to use the χ2-statistics. This was made with the grppha task included in ftools.
3.2. XMM-Newton data
All XMM-Newton observations were obtained from the EPIC pn camera5. The data were reduced in a systematic, uniform way using the Science Analysis Software (SAS6), version 11.0.0. Before extracting the spectra, good-timing periods were selected (i.e., flares were excluded). The method used for this purpose maximizes the signal to noise ratio of the net source spectrum by applying a different constant count rate threshold on the single-events, E > 10 keV field-of-view background light curve. The nuclear positions were taken from NED, while the extraction region was determined through circles of 25″ radius and the background was determined with an algorithm that selects the best circular region around the source, that is free of other sources and as close as possible to the nucleus. This automatic selection was checked manually to ensure the best selection for the backgrounds.
We extracted the source and background regions with the evselect task. RMFs were generated using the rmfgen task, and the ARFs were generated using the arfgen task. We then grouped the spectra to obtain at least 20 counts per spectral bin using the grppha task, as is required to use the χ2-statistics.
3.3. Light curves
Light curves in the 0.5–10 keV band for the source and background were extracted using the dmextract task for XMM-Newton and evselect task for Chandra with a 1000 s bin. The light curve from the source was manually screened for high background and flaring activity. This means that when the background light curve showed flare-like events and/or prominent decreasing/increasing trends, we did not use those intervals. After rejecting the respective time intervals, the total useful time for each observation was usually shorter than the original exposure time (see Table 2). The light curves are shown in Figs. C.1–C.7, where the solid line represents the mean value of the count rate and the dashed lines represent 1σ standard deviation.
4. Methodology
The spectral fitting process comprises two steps: (1) individual analysis of each observation to determine the best fit for each spectrum; and (2) simultaneous fitting of the set of spectra of the same object at different epochs. We used XSPEC7 version 12.7.0 for the spectral fitting.
4.1. Individual spectral analysis
We performed an individual study of the best-fit model for each observation. For this, we followed the method used by González-Martín et al. (2009b), where five different models were used:
-
1.
ME: a pure thermal model (MEKAL in XSPEC). The thermalemission is responsible for the bulk of the X-ray energydistribution. The free parameters in this model are the columndensity, NH, the temperature, kT, and the normalization, Norm.
-
2.
PL: a single power law model, which corresponds to a non-thermal source representing an AGN. The column density, NH, is added as a free parameter to take the absorption by matter along our line of sight to the target into account. The free parameters in this model are the column density, NH, the slope of the power law, Γ, and the normalization, Norm.
-
3.
2PL: a model containing two power laws with the same slope, Γ. Here the bulk of the hard X-rays is due to a primary continuum described by a power law, and the soft X-rays come from a scattering component described by the other power law. The free parameters in this model are the column densities, NH1 and NH2, the slope of the power-law, Γ, and the normalizations, Norm1 and Norm2.
-
4.
MEPL: a composite of a thermal plus a single power law model. The AGN dominates the hard X-rays, but the soft X-rays require an additional thermal contribution. The free parameters in this model are the column densities, NH1 and NH2, the temperature, kT, the slope of the power law, Γ, and the normalizations, Norm1 and Norm2.
-
5.
ME2PL: a composite of a thermal plus two power law model. This model is like MEPL, but including the contribution of the thermal emission at soft X-rays. This is the Compton-thin Seyfert 2 baseline model used by Guainazzi et al. (2005). The free parameters in this model are the column densities, NH1 and NH2, the temperature, kT, the slope of the power law, Γ, and the normalizations, Norm1 and Norm2.
For models 2PL, MEPL, and ME2PL we used two absorbers, NH1 and NH2. These absorbers are included in the models as abs(NH1)*PL + abs(NH2)*PL, abs(NH1)*Mekal + abs(NH2)*PL, and abs(NH1)*(PL) + Mekal + abs(NH2)*PL. The Galactic absoption was included in each model and was fixed to the predicted value (Col. 7 in Table 1) using the nh tool within ftools (Dickey & Lockman 1990; Kalberla et al. 2005). We searched for the neutral iron fluorescence emission line, FeKα, adding a narrow Gaussian with centroid energy fixed at the observed energy corresponding to a rest frame at 6.4 keV. Two Gaussians were also included to model the recombination lines FeXXV at 6.7 keV and FeXXVI at 6.95 keV.
We imposed the following conditions to the resulting best-fit parameters to ensure a physical meaning to the best-fit solutions: Γ > 0.5, NH1 > NGal and NH2 > NH1.
We selected as the best fit the spectral fitting with χ2/d.o.f. closer to unity and an F-test probability lower than 10-5 compared with a simpler model (Box 1953). Thus, the best-fit model is the simplest model that represents the data.
4.2. Simultaneous spectral analysis
The aim of this analysis is to detect variability and study the physical parameters governing its pattern for these sources. For that we simultaneously fitted the spectra for each object to the same model. The baseline model for this simultaneous fit was the best fit obtained for the individual fitting of the observations. When the best fit for individual sources did not match all observations, we used the most complex one. For each galaxy, the initial values for the parameters were set to those obtained for the spectrum with the largest number of counts.
The simultaneous fit was made in three steps. First, every spectrum was fitted with the
same model and all parameters linked to the same value (SMF0). If this model was able to
fit all spectra, the source is not variable. SMF0 was used as the baseline model for the
next step otherwise. Second, we let the parameters NH1,
NH2, Γ, Norm1, Norm2, and
kT vary individually (SMF1). Among these we chose the best fit as that
with  /d.o.f. closest to the
unity, which improved the SMF0 fit (using the F-test). The result of SMF1 was used as the
baseline model for the next step. Finally, we also included the possibility that two
parameters could vary together to explain the variability pattern of the sources. For that
purpose we fitted each set of data, letting the parameter found as the best fit in SMF1
vary together with any of the other parameters of the fit (SMF2). Again, the
/d.o.f. closest to the
unity, which improved the SMF0 fit (using the F-test). The result of SMF1 was used as the
baseline model for the next step. Finally, we also included the possibility that two
parameters could vary together to explain the variability pattern of the sources. For that
purpose we fitted each set of data, letting the parameter found as the best fit in SMF1
vary together with any of the other parameters of the fit (SMF2). Again, the
 and F-test
were used to determine whether this additional complexity of the spectral fitting resulted
in a significant improvement of the final fit.
and F-test
were used to determine whether this additional complexity of the spectral fitting resulted
in a significant improvement of the final fit.
The final best fit could be (1) SMF0: the best simultaneous fit with each parameters tied together for all observations (i.e., non-variable source); (2) SMF1: in the best simultaneous fit only one parameter was allowed to vary among the observations; and (3) SMF2: the best simultaneous fit was that with two parameters allowed to vary during the observations.
A higher complexity of the spectral fitting (e.g., three parameters allowed to vary) was not required for our data set (see Sect. 5).
4.2.1. Different appertures
When data from Chandra and XMM-Newton were used together, an additional analysis was performed to ensure that the extra-nuclear emission did not produce the observed variability.
First, we extracted a spectrum from Chandra data with an aperture radius of 25″. Second, a spectrum of an annular region was extracted from Chandra data, whith Rext = 25″ and Rint = RChandra (Col. 4 in Table 2). When the contamination by the annular region to the 25″ Chandra data emission was higher than 50% in the 0.5–10.0 keV energy band (see Sect. 5), we did not consider the joint analysis since the accuracy of the derived parameters could be seriously affected. For lower contamination levels, we considered that Chandra data could be used to estimate the contribution of the annular region to the XMM-Newton spectrum. We extracted the Chandra spectrum in that ring (from Rint to Rext) and fitted the five models explained in Sect. 4.1. Then we included the resulting model, with its corresponding parameters frozen, in the fit of the XMM-Newton nuclear spectrum (the circular region with Rext), and extracted the parameters for the nuclear emission. Appendix B.1 shows the images corresponding to the data used for this analysis, where the different apertures are shown. This analysis was made for all the seven objects with Chandra and XMM-Newton spectra taken on similar dates.
4.3. Flux variability
We computed X-ray luminosities for the individual and simultaneous fits. UV luminosities were also obtained when possible (see below).
4.3.1. X-ray luminosities
We computed the X-ray luminosities and sigma errors for the soft and hard bands using XSPEC. Note that distances of the sources were taken from NED. We assumed a given object as variable if the luminosity variation was stronger than 3σ and as non-variable when its variations were below 1σ.
4.3.2. UV luminosities
Simultaneous XMM-Newton Optical Monitor (OM)8 data were used to compute the UV luminosities. This monitor has three different filters in the UV range, UVW2 centered at 1894 Å (1805–2454) Å, UVM2 centered at 2205 Å (1970–2675) Å, and UVW1 at 2675 Å (2410–3565) Å. We used these three filters whenever possible.
We used the OM observation FITS source lists9 to obtain the photometry. We checked that the photometry using IRAF and the Vega magnitude system and calculating the luminosities by using SAS to estimate the count rate gave similar results. When OM data were not available, we searched for UV information in the literature (see Appendix A).
When simultaneous observations from X-rays and UV with XMM-Newton were
available, we computed the X-ray to UV flux ratio defined as
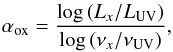 (1)where
LUV were computed from UVM2 and
UVW1 filters and Lx was computed using the integral
(1)where
LUV were computed from UVM2 and
UVW1 filters and Lx was computed using the integral
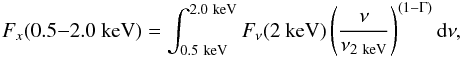 (2)leading
to
(2)leading
to 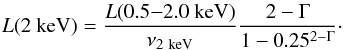 (3)
(3)
4.4. Short timescale variability
We analyzed the light curves for each observation to check for variability on short timescales in the sample.
Assuming a constant count rate for the whole observation, we calculated the χ2/d.o.f. test as a first approximation to the variations. We considered the source to be variable if the count rate differed from the average above 3σ (or 99.7% probability).
To check the variability amplitude of the light curves, we calculated the normalized
excess variance,  . We
followed prescriptions given by Vaughan et al.
(2003) to estimate
. We
followed prescriptions given by Vaughan et al.
(2003) to estimate  and its
error,
and its
error,  (see also González-Martín et al. 2011b):
 where
x, σerr and N are the
count rate, its error and the number of points in the light curve, respectively, and
S2 is the variance of the light curve,
where
x, σerr and N are the
count rate, its error and the number of points in the light curve, respectively, and
S2 is the variance of the light curve,
 (6)
(6)
5. Results
5.1. Individual objects
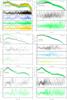 |
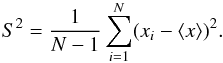
Fig. 1 For each object, all X-ray spectra are plotted together in the first row. Best fits and their residuals are also shown, one row per observation from the second row on. The legends contain the date (in the format yyyymmdd) and the obs ID. Details are given in Table 2. |
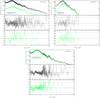 |
Fig. 1 continued. |
Here we present the results of the variability of the seven sources individually. General results are given in Sect. 5.2. Each subsection describes the following: the observations used in the analysis (Table 2), variations of the hardness ratio (from Col. 8 in Table 2), individual and simultaneous best fit and the parameters varying in the model (see Tables 3–5 and Fig. 1), X-ray flux variations (see Table 6 and Fig. 2), the analysis of the annular region when data of Chandra and XMM-Newton were used together (Table 7 and Appendix B.1), and the simultaneous fittings of these observations (Table 8), short-term variability from the analysis of the light curves (see Table 9 and Appendices C.1–C.7), and UV luminosities when simultaneous data from the OM monitor was available (Table 10, Fig. 2). Moreover, a summary of the variability is given in Table 11. Notes and comparisons with previous works for individual objects are included in Appendix A.
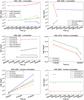 |
Fig. 2 Intrinsic luminosities calculated for the soft (0.5–2.0 keV) and hard (2.0–10.0 keV) energies in the simultaneous fitting and UV luminosities obtained from the data with the OM camera onboard XMM-Newton, when available. |
5.1.1. NGC 1052
We used one Chandra and four XMM-Newton observations. These four XMM-Newton observations were taken from August 2001 to August 2009, and the Chandra observation was taken in August 2000 (see Table 2).
Variations of 33% (10%) in HR were obtained between the first and the last XMM-Newton (Chandra) observations (see Col. 8 in Table 2).
The individual fits gave ME2PL as the best fit. In this case SMF2 was used, because it is the best representation of the observed differences (see Fig. 1) when varying Norm2 and NH2 (see Tables 3–5). Variations were 49% (Norm2) and 31% (NH2) between the first and the last observations.
In Fig. 2, variations of the soft and hard intrinsic luminosities of the simultaneous fitting are presented. At soft energies we found variations at 8.3σ (20%), and at hard energies at 7.5σ (20%) over a period of eight years. The strongest variation for Norm2 was found between the second and the third observation (see Table 5) with an interval of three years, where both soft and hard luminosities varied by 12% and 29% respectively (see Table 6). The strongest variation for NH2 was obtained between the first and the second observation (see Table 5) with a 32% change in four years.
We compared the Chandra observation from 2000 with the XMM-Newton observation from 2001 (see Fig. B.1), following the prescriptions given in Sect. 4.2.1. The spectral analysis of Chandra data was included in Tables 5 and 6, which gave ME2PL as the best fit. The annular region represented a 10% of the 25″ Chandra aperture luminosity in the 0.5–10 keV band. The Chandra data for the 25″ radius circular region provided intrinsic luminosities representing 22% (75%) for the soft (hard) energy of the emission from XMM-Newton data (see Table 6). After taking into account the contribution from the annular region, the analysis indicated no changes in one year period (see Tables 7 and 8) in the nuclear emission.
According to the values of  and
σ2 showed in Table 9, the analysis from the light curves did not show short timescale variations
(see Fig. C.1), in either the
XMM-Newton or the Chandra data, because variations
were below 3σ.
and
σ2 showed in Table 9, the analysis from the light curves did not show short timescale variations
(see Fig. C.1), in either the
XMM-Newton or the Chandra data, because variations
were below 3σ.
In Fig. 2 UV luminosities (Table 10) are represented for the UVW2 and UVM2 filters. Variations at 7.3σ (or 16–25%) and 2σ (or 2–23%) were obtained, respectively.
5.1.2. NGC 3226
We used two XMM-Newton observations in November 2000 and December 2006 and one Chandra observation from December 1999.
Variations in the HR of 100% were obtained both from the Chandra and the XMM-Newton data (see Col. 8 in Table 2). However, Obs ID 0400270101 from XMM-Newton was not used for the discussion (see below).
The observation from 2000 gave as best fit the 2PL model, while that from 2006 was best fitted with the PL. The simultaneous spectral fitting was better represented by the 2PL model varying NH2 (i.e., SMF1, Fig. 1), with a 74% amplitude variation. The resulting parameters (see Tables 5 and 6) indicate that X-ray soft and hard intrinsic luminosity variations were below 1σ over a period of six years.
We compared the Chandra observation from 1999 with the XMM-Newton observation from 2000. The spectral analysis of Chandra data was included in Tables 5 and 6. The contribution from the annular region to the 25″ aperture Chandra data was 20% in the 0.5–10.0 keV band. The Chandra spectrum extracted with 25″ aperture represented 62% (70%) of the XMM-Newton soft (hard) emission (Table 7). When the contribution from the annular region was taken into account, the simultaneous fit resulted in variations of NH2 (93%) and Norm2 (57%), with 37% (81%) variations in the soft (hard) energies in a one-year period (Table 8).
We analyzed short timescale variability from individual light curves by calculating
χ2 and σ2 (see Table 9 and Fig. C.2
(up)). Data from 2006 showed  and
a normalized excess variance
σNXS = 1.8 ± 0.1 × 10⁻², indicating variability
(see Fig. C.2, upper-right). However, NGC 3227 is a
strongly variable Seyfert 1 located 2′ from NGC 3226. Thus, we analyzed the possibility
that NGC 3226 was contaminated by its emission. We extracted a light curve from NGC 3227
and from a circular region between both galaxies close to NGC 3226 (background) and
found the same pattern of variability. In Fig. C.2
we present the light curves for the background (middle-left) and NGC 3227
(middle-right), and the XMM-Newton image (down). The normalized excess
variance for the background light curve was
σNXS = 1.5 ± 0.5 × 10⁻². Therefore, we conclude
that NGC 3226 might be contaminated by emission from NGC 3227, so its short timescale
variability cannot be assessed. Only UVW1 observations
are available from OM (see Table 10 and Fig.
2), with a 10–12% variation
(7.4σ).
and
a normalized excess variance
σNXS = 1.8 ± 0.1 × 10⁻², indicating variability
(see Fig. C.2, upper-right). However, NGC 3227 is a
strongly variable Seyfert 1 located 2′ from NGC 3226. Thus, we analyzed the possibility
that NGC 3226 was contaminated by its emission. We extracted a light curve from NGC 3227
and from a circular region between both galaxies close to NGC 3226 (background) and
found the same pattern of variability. In Fig. C.2
we present the light curves for the background (middle-left) and NGC 3227
(middle-right), and the XMM-Newton image (down). The normalized excess
variance for the background light curve was
σNXS = 1.5 ± 0.5 × 10⁻². Therefore, we conclude
that NGC 3226 might be contaminated by emission from NGC 3227, so its short timescale
variability cannot be assessed. Only UVW1 observations
are available from OM (see Table 10 and Fig.
2), with a 10–12% variation
(7.4σ).
5.1.3. NGC 3627
We used one XMM-Newton observation in May 2001 and another Chandra observation in March 2008 (see Table 2). We recall that different apertures (8″ for Chandra and 25″ for XMM-Newton) were used to extract the nuclear spectrum.
Since observations were obtained with different instruments, comparisons of HR were avoided.
According to , both
spectra were individually best-fitted with the MEPL model. The best simultaneous fit
implied variations in NH2 (Fig. 1), from no absorption to
NH2 = 1.28 × 1022 cm-2 in a
seven-year period (i.e., SMF1, Table 5). Even if
observed fluxes vary, when computing intrinsic luminosities (see Table 6) for this model we obtained variations below
1σ in the soft and hard energies, indicating no variations in seven
years (Fig. 2).
To compare Chandra and XMM-Newton data, we carried out the analysis explained in Sect. 4.2.1. The contribution of the annular region to the 25″ aperture Chandra spectrum is ~92% in the 0.5–10 keV band (see Table 7). Thus we assumed that XMM-Newton data were strongly contaminated by emission surrounding the nucleus, which avoided the joint use of Chandra and XMM-Newton data for this object (see Sect. 4.2.1).
The analysis of the light curves did not show short timescale variability (see Table 9 and Fig. C.3), since all measures were below 2σ from the average.
5.1.4. NGC 4261
We used two Chandra (May 2000 and February 2008) and two XMM-Newton observations (December 2001 and December 2007) for this object. Given the different resolutions in both sets of observations, we first performed the analysis separately (see Table 2).
Variations of 19% and 0% in HR were obtained for Chandra and XMM-Newton, respectively (from Col. 8 in Table 2).
The best fit for the Chandra spectra is the ME2PL model from the individual analysis. The simultaneous fit without allowing to vary any parameter (i.e., SMF0) resulted in a good fit (χ2/d.o.f. = 1.27). Varying one parameter did not improve the final fit. Therefore, the source seemed to be non-variable (see Table 5 and Fig. 1). X-ray luminosity variations were below 1σ for the soft and the hard bands over a period of eight years (Table 6 and Fig. 2).
The individual analysis of the two observations with XMM-Newton again gave the ME2PL model as best fit, and variations in the parameters did not improve the fit (i.e., the best fit was SMF0). Thus, we obtained a non-variable source (Table 5 and Fig. 1). X-ray luminosity variations were below 1σ in a six-year period in this case (Table 6 and Fig. 2).
To compare data from Chandra and XMM-Newton, the procedure explained in Sect. 4.2.1 was applied to this object. We compared obs ID 9569 from Chandra and obs ID 0502120101 from XMM-Newton data (Fig. B.1) since they are the closest in time. The contribution of the emission from the annular region was 37% in the 0.5–10 keV band emission in the 25″ aperture Chandra data. Intrinsic luminosities of the 25″ aperture Chandra spectrum represented 37% (66%) of the soft (hard) emission from XMM-Newton data. The simultaneous fit between these data taking into account the annular contribution resulted in a non-variable object (Table 8).
To check for short timescale variability we analyzed the light curves for each observation (see Table 9 and Fig. C.4). No short time variability was detected for this object, since all measurements were below 2σ from the average.
Considering the UV range (Table 10), the variations amounted to 9–11% (10.3σ) in the UVW1 filter and 28–39% (9.3σ) in the UVM2 filter (see Fig. 2).
5.1.5. NGC 4278
We only used three of the nine observations taken by Chandra in March 2006, February 2007, and April 2007, and the XMM-Newton observation in May 2004 (Table 2).
HR variations amounted to 4% for the runs with useful spectroscopic Chandra data. Taking into account all observations from Chandra, 40% HR variations were found between 2000 and 2010 (from Col. 8 in Table 2).
Our best fit for Chandra data was the MEPL model with Norm2 varying (i.e., SMF1, see Fig. 1). This parameter varied by 30% between the first and the last observation (about one year apart) (Table 5). X-ray intrinsic luminosity variations (Table 6) were within 11.2σ (9.6σ) for the soft (hard) energies. This corresponded to variation amplitudes of 26% (29%, see Fig. 2). It is remarkable that the flux varied by 11% (13%) between the second and third observations (two months apart), with a 13% variation in Norm2 for the same period (Tables 5 and 6).
We compared the XMM-Newton observation in 2004 with the Chandra observation in 2006, which is the closest in time (see Fig. B.1). We applied the procedure explained in Sect. 4.2.1. The spectral analysis of XMM-Newton spectrum, included in Tables 5 and 6, gave the PL as the best-fit model. The contribution of the annular region is 38% in the 0.5–10.0 keV band to the emission in the 25″ aperture Chandra data. The Chandra spectrum extracted with 25″ aperture represented 25% (20%) of the soft (hard) XMM-Newton emission. When the contribution of the annular region was taken into account, the resulting Γ agreed with that from XMM-Newton data (see Table 7). The simultaneous fit shows 15% of variations in the normalization of the PL along two years (Table 8).
The analysis of the light curves (see Table 9 and Fig. C.5) did not show short timescale variability, either in Chandra or in XMM-Newton data.
5.1.6. NGC 4552
We used a Chandra observation taken in April 2001 and an XMM-Newton observation taken in July 2003. We recall that different apertures were used (3″ for Chandra and 25″ for XMM-Newton data).
Since observations were obtained with different instruments, comparisons of HR were avoided.
Both observations needed MEPL for the individual best fit. When varying parameters, the
best fit was obtained when Norm1 and
Norm2 varied (i.e., SMF2,
 ,
see also Fig. 1), with 93% and 78% amplitude
variations (see Table 5). We found intrinsic
luminosity variations at 21.5σ (14.1σ) in the soft
(hard) energies, i.e., 87% (79%) amplitude variations in a period of two years (Table
6).
,
see also Fig. 1), with 93% and 78% amplitude
variations (see Table 5). We found intrinsic
luminosity variations at 21.5σ (14.1σ) in the soft
(hard) energies, i.e., 87% (79%) amplitude variations in a period of two years (Table
6).
The Chandra image of this object revealed many X-ray sources surrounding the nucleus (see Fig. B.1). The contribution of the annular region to the 0.5–10.0 keV band emission in the 25″ aperture Chandra data was 23%. Extraction from Chandra data with 25″ aperture resulted in a 72% (60%) emission of the soft (hard) XMM-Newton data. The simultaneous fit resulted in a variable object, where Norm1 (21%) and Norm2 (37%) varied, with 29% (37%) flux variations in the soft (hard) energies (see Fig. 2 and Table 8).
No short timescale variations were found (see Table 9 and Fig. C.6).
5.1.7. NGC 5846
We used two observations from XMM-Newton (January and August 2001) and other two observations from Chandra (May 2000 and June 2007). The analysis was first made separately because of the different apertures (see Table 2).
HR Variations of 1% and 6% were obtained for XMM-Newton and Chandra data, respectively (from Col. 8 in Table 2).
For the Chandra observations, we only made the analysis up to 3 keV because of the low count-rate at hard energies. In this case SMF0 was used, resulting in a non-variable source when fitting the MEPL model (Table 5 and Fig. 1) with flux variations below 1σ during a period of seven years (Table 6 and Fig. 2). The XMM-Newton data did not show variability (the best-fit model is MEPL, see Table 5 and Fig. 1), and flux variations below 1σ on the soft and hard energies for a period of seven months (Table 6).
The contribution to the 0.5–10.0 keV band emission from the 25″ aperture Chandra data was 73% from the annular region, which avoided the joint use of Chandra and XMM-Newton data for this object. No short timescale variability was found for this object (see Table 9 and Fig. C.7). The availability of UV data for a single epoch precludes any attempt to gain information on its variability.
5.2. Spectral variability
A rough description of the spectral shape is provided by HR. Consequently, a first approximation of the spectral variations can be obtained from the variation of HR. The use of HR allows including observations whose number of counts are not enough for a proper spectral fitting. Because the calculation of HR is based on number counts, we only used data coming from the same instrument for comparisons. We considered that variations greater than 20% (2σ error) in HR may correspond to variable objects (NGC 1052, NGC 3226, and NGC 4278). Note that variations in HR weaker than 20% can be found in variable objects, because the variations in soft and hard energies may have different signs and somewhat average each other out in the final calculation of HR.
The individual fitting of each observation revealed that composite models (2PL, MEPL or ME2PL) were needed in all cases. A thermal component was used in six objects, all of them with kT ≈ 0.60 keV.
We fitted all available data for the same object and model, varying different parameters to obtain information on the variability pattern. Figure 1 shows the best fit (top panel) with the residuals of the individual observations (bottom panels). To analyze the data from Chandra and XMM-Newton data jointly, we estimated the influence of extra-nuclear emission on the results (see Sect. 4.2.1). For two objects (NGC 3627 and NGC 5846) the contamination by emission surrounding the nucleus in XMM-Newton data was so high (up to 50%) that we avoided the comparisons in these cases. For the remaining five sources (NGC 1052, NGC 3226, NGC 4261, NGC 4278, and NGC 4552), the joint analysis was attempted.
Two objects are compatible with being non-variable sources, namely NGC 4261 and NGC 5846. For these two objects the same conclusion is reached if we isolate the analysis of Chandra and XMM-Newton data, both with similar spectral parameters (see Table 5). Moreover, NGC 3627 was no longer used for the discussion, since contamination prevents any variability analysis. Four objects are variable, NGC 1052, NGC 3226, NGC 4278, and NGC 4552. NGC 1052 and NGC 3226 showed variations in NH2 (31% and 93%) and Norm2 (49% and 57%) (in eight and one years), while NGC 4278 showed changes in Norm2 (30%) (in three years). NGC 4552 showed variations in Norm1 (21%) and Norm2 (37%) in a two-year period. All variations occur at hard energies and are related to the absorber and/or to the nuclear power. Even if the small number of sources precludes any statistical characterization, there does not seem to exist any clear relation with either the LINER type (1 or 2) or to the Eddington ratios (see Table 11). A larger sample of LINERs is needed to search for any variability pattern to be eventually more frequently observed than others.
5.3. Flux variability
X-ray soft and hard luminosities (see Table 6) are shown in Fig. 2. Two objects are compatible with no variations of the central engine (NGC 4261, and NGC 5846). Four sources are compatible with being variable, NGC 1052 with 20% variations in both bands, NGC 3226 with 37% (81%) variations in the soft (hard) band, NGC 4278 with 26% (29%) variations in the soft (hard), and NGC 4552 with 29% (37%) variations in the soft (hard) band. Sources showing flux variability in the soft and hard bands also showed spectral variability (see Sect. 5.2).
We also studied the UV variability for the sources by studying UV and X-ray data obtained simultaneously with XMM-Newton (available for three galaxies). All of them are variable at UV frequencies (see Table 10 and Fig. 2). XMM-OM provided UV fluxes at three epochs for NGC 1052; ~20% variations were obtained with the filters UVW2 and UVM2. NGC 3226 was observed with the filter UVW1, showing 11% variation. NGC 4261 was observed with the filters UVW1 and UVM2, with 10% and 33% variations, respectively. Two objects, NGC 1052 and NGC 3226, showed UV and spectral variability, while another one, NGC 4261, showed UV variability but no spectral variability.
5.4. Light curves
Table 9 provides the values for
(and the
probability of variability) and the  . Objects
are considered to be variable when the count rates are different 3σ from
the average. No short-term variability (from hours to days) was found in our sample10.
. Objects
are considered to be variable when the count rates are different 3σ from
the average. No short-term variability (from hours to days) was found in our sample10.
6. Discussion
We have performed an X-ray spectral analysis to search for variability in seven LINER nuclei, three type 1.9 (NGC 1052, NGC 3226, and NGC 4278) and four type 2 (NGC 3627, NGC 4261, NGC 4552, and NGC 5846). We used data from Chandra and XMM-Newton satellites with observations at different epochs. Whenever possible, we made the analysis separately for each instrument to avoid corrections due to different apertures. The results obtained for the long-term variability of NGC 3627 will not be used for the discussion (see Sect. 5.1.3).
Our main results are the following:
-
Short-term variability: No variations were found on timescalesfrom hours to days.
-
Long-term variability: Four out of the six objects (NGC 1052, NGC 3226, NGC 4278, and NGC 4552) were variable in X-rays on timescales from months to years. The shortest variation is found for NGC 4278 on timescales of two months. Simultaneous observations in the UV for three objects (NGC 1052, NGC 3226, and NGC 4261) revealed variations on timescales of years.
-
Main driver for the variability: Among the variable sources, NGC 4278 presented variations in Norm2, NGC 4552 in Norm1 and Norm2, and NGC 1052 and NGC 3226 in NH2 and Norm2. In all variable LINERs variations occur at hard energies.
6.1. Short and long timescale variability
In our sample of LINERs we analyzed variability from hours to days (short-term) from the analysis of the light curves for each observation (see Col. 6 in Table 2), and from months to years (long-term) from the simultaneous fitting of the different observations (see Col. 10 in Table 11).
Concerning short timescales, Pian et al. (2010)
studied four type 1 LINERs and found variations of 30% in a half a day in NGC 3998, and
30% variations in the hard (1–10 keV) X-rays in ~3 h in M 81. The other two sources in
their sample (NGC 4203 and NGC 4579) showed no short timescale variability. The power
spectral density (PSD) profiles of the 14 LINERs included in the sample of 104 AGN in
González-Martín & Vaughan (2012), showed
no short-term variability except for two objects (3C 218 and NGC 3031). All these studies
suggest that about 20% of LINERs show short timescale variability. This percentage
approaches zero in our own study, since none of our seven sources showed short timescale
variability, according to the and the
normalized excess variance, , (see Table
9). Younes et al.
(2010) found variability in ~1.5 h for NGC 4278 on the
XMM-Newton observation, where the flux increased by 10%. Using the same
observation, we found a 3% flux increase in the same period, and a null probability of
being a variable source. The difference is most probably due to the different appertures
used in the analysis. Adding all studied LINERs from this and previous papers, the
percentage of variable LINERs at short timescales is 16%.
Long-term spectral variability is clearly found for four objects in our sample. NGC 1052 needed variations in NH2 (49%) and Norm2 (31%) in a period of eight years, NGC 3226 also varied NH2 (93%) and Norm2 (57%) in a period of one year, NGC 4278 varied Norm2 (30%) in a period of one year, and NGC 4552 varied Norm1 (21%) and Norm2 (37%) in two years.
Long-term variability is common among LINERs. Younes et al. (2011) studied a sample of type 1 LINERs, where seven out of nine sources showed long-term variability (i.e., months and/or years). Two of their objects are in common with our sample, NGC 3226 and NGC 4278. We found similar spectral characteristics and the same parameters varying for both objects. For NGC 3226, they found that NH varied by 72% and Norm varied by 48% when fitting a simple power law. This is similar to our results, although we used two absorbers instead of one. They found flux variations of 49% (46%) in the soft (hard) band between the Chandra and XMM-Newton observations, while we found 37% (81%), the differences most probably due to the different models used. For NGC 4278 they used seven public observations from the archive, while we only used three. Despite this, the same spectral variation was found (Norm2). Younes et al. (2010) found for NGC 4278 a 31% (20%) variation at soft (hard) energies, where we found 26% (29%) variation for the same observations. Pian et al. (2010) found long-term variability in two of their four type 1 LINERs using Swift data. Therefore, long-term variability is found in ~65% of the LINERs, significantly more than that of LINERs at short timescales.
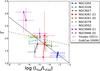 |
Fig. 3 Anticorrelation between the spectral index, Γ from individual fits, vs. the Eddington ratio, log (Lbol/LEdd), for our sample galaxies. The solid line represents the relation given by Younes et al. (2011), while the dashed line represents that by Gu & Cao (2009), both shifted to the same bolometric correction (see text). |
Three types of long-term X-ray variability patterns have been found in our sample: (1) variations in the soft excess (NGC 4552); (2) variations of the obscuring matter (NGC 1052 and NGC 3226); and (3) variations of the intrinsic source (NGC 1052, NGC 3226, NGC 4278, and NGC 4552). As for NGC 4552, variations at soft energies have already been reported in the literature for the type 2 LINER NGC 4102 (González-Martín et al. 2011a). This behavior is seen in type 1 Seyferts, where absorption variations are related to a partially ionized, optically thin material along the line of sight to the central source, the so-called warm absorber (Reynolds 1997; Petrucci et al. 2013). The variations due to the NH of the X-ray absorbing gas that we see in two sources are well established for many famous type 2 Seyferts. These variations are thought to be related to the motion of clouds perpendicular to the line of sight of the observer to the AGN. These clouds produce partial eclipses of the AGN over time. In some cases, the fast movement of the clouds places them at the distance of the BLR, although in other cases the clouds seem to be located at farther distances (few parsecs) from the AGN (e.g. NGC 1365 Risaliti 2002; Risaliti et al. 2007, 2010; Braito et al. 2013). The timescale of the NH variations in our sample are consistent with this latter scenario. The most common pattern of variability among the LINERs in our sample (four cases) is the change on the intrinsic continuum of the source. McHardy et al. (2006) found that the timescale of the intrinsic variability increases for larger masses of the black hole and/or lower bolometric luminosities for objects whose variability is related to the nuclear power11. According to the revised relation between the BH mass, bolometric luminosities and timescales of variations, González-Martín & Vaughan (2012) predicted that LINERs (with MBH ~ 108−9 M⊙) do not vary on timescales shorter than tens of days. Applying their formula to our four objects, predicted values for NGC 1052, NGC 3226, NGC 4278, and NGC 4552 were 13.3, 28.2, 118.0, and 449.9 days (see Table 11 for the values of MBH and Lbol), that is, timescales of days, months, and years were expected for these objects. This agrees with our results for NGC 4278 and NGC 4552. Unfortunately, we have no observations within days for NGC 1052 and NGC 3226, we were only able to search for variations on timescales from months to years. Moreover, for NGC 1052, NGC 3226, and NGC 4552 coupled variations12 were obtained. A study of a larger sample of LINERs is required to constrain the timescale of the intrinsic variability for these sources and be able to understand whether LINERs match in the same scenario as more powerful AGN.
A first approximation of the variations can be obtained by analyzing the hardness ratios. We considered differences in HR larger than 20% as a measure of spectral variation. For NGC 1052, HR varied 33% between the first and last XMM-Newton observations and no variation was found for HR over the five-year period observed by Chandra. These results are compatible with flux variations obtained when analyzing XMM-Newton data. NGC 3226 presents HR differences over 100% in Chandra data. For NGC 4278 total HR variations amount to 40% when using all available Chandra data, although the results from the Chandra data used for spectral analysis appear to be compatible with no variations. NGC 4261 and NGC 5846 are compatible with being non-variable objects, both with XMM-Newton and Chandra data, and with both analyses, spectroscopic and HR. NGC 4261 shows HR differences of 19%, which seem to be compatible with the flux variations obtained through the individual analysis of the source.
Variability among LINERs is not restricted to X-rays. Maoz et al. (2005) was the first to show variability at UV frequencies in LINER galaxies, where all but three objects in their sample of 17 LINERs of type 1 and 2 were variable. From the literature, we found different studies for the LINERs in our sample using HST data (see Appendix A for details). Cappellari et al. (1999) studied FOC data for NGC 4552, and found a factor 4.5 brightening between 1991 and 1993 (filter F342W), followed by a factor ~2 dimming between 1993 and 1996 (filters F175W,F275W and F342W). Maoz et al. (2005) studied both NGC 1052 and NGC 4552, concluding that both of them were variable on timescales of years. NGC 4278 was studied by Cardullo et al. (2008), who found a luminosity increase of a factor 1.6 over six months. UV data were not available for the remaining two objectsin our sample (NGC 3627 and NGC 5846). Thus, from the seven LINERs in our sample five seem to be variable at UV frequencies. Simultaneous X-rays and UV data were obtained from XMM-Newton data for three objects (NGC 1052, NGC 3226, and NGC 4261), all showing variability, whereas intrinsic variations in X-rays were not found for NGC 4261. A possible explanation for this source’s non-simultaneous X-ray and UV variation could be time lags in both frequencies. Time lag explanations have previously been reported for the NLSy1 galaxy NGC 4051 by Alston et al. (2013). Repeated simultaneous observations at X-rays and UV frequencies are required to verify this model.
6.2. Accretion mechanism
It has been suggested in the literature that the accretion mechanism in low-luminosity active galactic nuclei (LLAGN) is different from that in more powerful AGN (e.g., Seyferts), and more similar to that in X-ray binaries (XRB) in their low/hard state (Yamaoka et al. 2005; Yuan et al. 2007; Gu & Cao 2009; Younes et al. 2011; Xu 2011). The X-ray emission is supposed to originate from the Comptonization process in advection-dominated accretion flow (ADAF), where accretion is inneficient for Lbol/LEdd < 10-3. At low accretion rates, the infalling material may never cool sufficiently to collapse into a thin disk (as is the case for efficient radiation), and an advection-dominated flow from the outermost radius down to the black hole could be formed (Narayan & Yi 1994). In powerful AGN a positive correlation between the hard X-ray photon index, Γ, and the Eddington ratio, Lbol/LEdd was found by Shemmer et al. (2006), who argued that the hard X-ray photon index depends primarily on the accretion rate. In contrast, according to the results provided by Mahadevan (1997), the lower the accretion rate, the less efficient is the cooling by Comptonization and the X-ray region of the spectrum becomes softer and reaches lower luminosities. In this case a negative correlation between these magnitudes has been found for LLAGN (Gu & Cao 2009; Younes et al. 2011) and also for XRB. We present these parameters for each individual observation in our sample of LINERs in Fig. 3, where the negative correlation is shown. Log (Lbol/LEdd) were calculated following the formulation given in Eracleous et al. (2010), using Lbol = 33L2−10 keV. We corrected the equation given by Younes et al. (2011) by this factor (they used Lbol = 16L2−10 keV) and plotted it as a solid line. Our results are consistent with the correlation given by Younes et al. (2011) for their sample of type 1 LINERs. Emmanoulopoulos et al. (2012) found for the first time a “harder when brighter” (i.e., higher luminosities for harder spectra) X-ray behavior for the LLAGN NGC 7213, where they found variations in Γ. However, we did not find this behaviour for any of the sources in our sample, Fig. 3 showing the consistency of our simultaneous fittings with no variations in Γ.
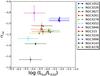 |
Fig. 4 Correlation between the X-ray to UV flux ratio, αox, vs. the Eddington ratio, log (Lbol/LEdd). Star symbols correspond to the sources in Younes et al. (2012). |
We also computed the X-ray-to-UV-flux ratio, αox (see Sect. 4.3.2). We calculated these values for all sources with simultaneous observations at X-ray and UV (see Table 10), obtaining values of αox between [–0.81, –1.66], in good agreement with previous studies (Maoz 2007; Younes et al. 2012). Although they are similar to the αox given for powerful AGN, these values were slightly lower (Maoz 2007). This may indicate the lack or absence of the “big blue bump”.
When αox could be calculated more than once (NGC 1052 and NGC 4261), no variations were found within the errors.
Another indication of a different emission process between powerful AGN and LINERs could be the positive correlation found by Younes et al. (2012) between αox and log (Lbol/LEdd), in contrast with the anticorrelation found for powerful AGN. To compare the results from Younes et al. (2012) and ours, we recalculated log (Lbol/LEdd) for the sample in Younes et al. (2012) following the relation given by Eracleous et al. (2010) and using the data from Younes et al. (2011). In Fig. 4 we plot this relation (see Table 10), where the symbols used for the sources from Younes et al. (2012) are stars. The results agree well, indicating a correlation between αox and log (Lbol/LEdd). Younes et al. (2012) suggested that this behavior can be understood within the framework of radiatively inefficient accretion flow models, such as ADAF.
7. Conclusions
A spectral variability analysis of seven LINER nuclei was performed using public data from Chandra and XMM-Newton. The main conclusions of this paper can be summarized as follows:
-
1.
Variations greater than 20% in the hardness ratio always correspond to objects showing spectral variability.
-
2.
Individual fits of each observation provided composite models as the best fit (2PL, MEPL, and ME2PL).
-
3.
No short timescale variability was found, in agreement with predictions.
-
4.
Spectral X-ray variability was found in four out of six objects. In all of them variations occurred at hard energies due to the absorber and/or the nuclear source, and variations in the soft energy were found only in NGC 4552. These variations occur on timescales of months and/or years. The shortest timescale was found for NGC 4278, with variations of two months.
-
5.
We found an anticorrelation between the X-ray spectral index, Γ, and the Eddington ratio, Lbol/LEdd. We also found a correlation between the X-ray to UV flux ratio, αox, and the Eddington ratio, Lbol/LEdd. Both relations are compatible with inefficient flows being the origin of the accretion mechanism in these sources.
Online material
Observational details.
F-test and χ2/d.o.f. applied to the SMF0.
F-test and χ2/d.o.f. applied to the SMF1.
Final compilation of the best-fit models for the sample, including the individual best-fit model for each observation, and the simultaneous best-fit model with the varying parameters.
Soft (0.5–2 keV) and hard (2–10 keV) intrinsic luminosities for individual (Cols. 3 and 5) and simultaneous (Cols. 4 and 6) fitting.
Results for the best fit of the annular region (ring) in Chandra data, and the best fit obtained for the nucleus of XMM-Newton data when the contribution from the annular region was removed.
Statistics for the light curves. Name (Col. 1), obs ID (Col. 2), χ2/d.o.f. and the probability of being variable (Cols. 3 and 4) and normalized excess variance with errors (Cols. 5 and 6).
UV luminosities derived from the OM observations. Name (Col. 1), obs ID (Col. 2), filter (Col. 3) and luminosity (Col. 4).
Summary.
Appendix A: Notes and comparisons with previous results for individual objects
Appendix A.1: NGC 1052
The brightest elliptical galaxy in the Cetus I group, NGC 1052, previously classed as a LINER in the pioneering work by Heckman (1980), was classified as LINER type 1.9 by Ho et al. (1997).
NGC 1052 was observed twice with Chandra and five times with the
XMM-Newton satellite, which makes it a good candidate for studying
variability. The general characteristics of the two Chandra
observations Obs ID 385 (taken in 2000) and Obs ID 5910 (2005) were reported
by González-Martín et al. (2009b) and Boroson et al. (2011), respectively, showing quite
different spectral behavior with a flatter spectral index, lower
NH, and lower luminosity in 2005. We analyzed the
observation from 2005 and found a different spectral fit than Boroson et al. (2011), since they used the PL model to fit the
spectrum. However, similar luminosities were found between González-Martín et al. (2009b), Boroson et al. (2011), and this work (with
 ,
,
 0.01 and
 ,
respectively).
,
respectively).
Only one XMM-Newton observation (Obs ID 306230101 taken in 2006) was previously analyzed by González-Martín et al. (2009b) and Brightman & Nandra (2011), showing quite similar results as Brightman & Nandra (2011) in spite of a more absorbed spectrum in the latter. Our results agree well with those provided by González-Martín et al. (2009b). The most recent observation at X-rays reported so far is a 100 ks observation taken with Suzaku in 2007. The derived spectral characteristics reported by Brenneman et al. (2009) appear to be similar to those from XMM-Newton, which is compatible with the values in González-Martín et al. (2009b), Brightman & Nandra (2011), and this paper (intrinsic luminosity of log (L(2−10 keV)) ~ 41.5 ).
In the UV range, Maoz et al. (2005) studied this galaxy with HST-ACS and found a decrease in the flux of the source of a factor of 2 between the 1997 data reported by Pogge et al. (2000) and their 2002 dataset. We found UV flux variations of a factor of 1.3 from XMM-OM data in seven months.
Appendix A.2: NGC 3226
NGC 3226 is a dwarf elliptical galaxy that is strongly interacting with the Seyfert 1.5 galaxy NGC 3227, located at 2′ in projected distance (see Fig. C.19 in González-Martín et al. 2009b). NGC 3226 was classified by Ho et al. (1997) as a type 1.9 LINER.
This galaxy was observed twice with Chandra-ACIS in 1999 and 2001 and four times with XMM-Newton from 2000 to 2006.
Chandra data taken in 1999 were analyzed by George et al. (2001) and those taken in 2001 by Terashima & Wilson (2003). In both cases the X-ray spectra were fitted to a single power law, but with differing column densities, the data in 2001 being a factor 2 more absorbed; this leads to a difference in the X-ray luminosity in the hard (2–10 keV) band of 70%. The reanalysis of these data performed by Younes et al. (2011) shows spectral parameters consistent with the previous studies, although their estimated difference in luminosity is lower (40%). We did not use these data because obs ID 1616 does not match our criteria of the minimum number of counts.
The analysis by Gondoin et al. (2004) of
snapshot XMM-Newton observations taken in 2000 also showed an X-ray
spectrum consistent with a power law with  , close to the value
obtained by George et al. (2001),
, close to the value
obtained by George et al. (2001),
 , for the same epoch.
Binder et al. (2009) studied the
XMM-Newton observation from 2006 and found significant short
timescale flux variation, with a fractional variability amplitude of 11.7. They
compared their measurements,
, for the same epoch.
Binder et al. (2009) studied the
XMM-Newton observation from 2006 and found significant short
timescale flux variation, with a fractional variability amplitude of 11.7. They
compared their measurements,  and
and  ,
with those from Gondoin et al. (2004) (see
above), finding variability on timescales of years. Younes et al. (2011) analyzed the longest exposure data from 2000 and 2006
and found a difference in the hard luminosity of 40%. Considering both Chandra
and XMM-Newton data (obs ID. 860 and 1616, 0101040301 and
0400270101, respectively), they concluded that the source variability is due to
modifications in the NH. We find spectral parameters in
agreement to those of Younes et al. (2011) for
the XMM-Newton and Chandra data and obtained a
for obs ID 0400270101, but
this observation seemed to be affected by the rapidly variable Seyfert 1.5 NGC 3227.
Binder et al. (2009) and Younes et al. (2011) found similar results for this galaxy, and
interpretated the variability as related to outflows or feedback processes.
,
with those from Gondoin et al. (2004) (see
above), finding variability on timescales of years. Younes et al. (2011) analyzed the longest exposure data from 2000 and 2006
and found a difference in the hard luminosity of 40%. Considering both Chandra
and XMM-Newton data (obs ID. 860 and 1616, 0101040301 and
0400270101, respectively), they concluded that the source variability is due to
modifications in the NH. We find spectral parameters in
agreement to those of Younes et al. (2011) for
the XMM-Newton and Chandra data and obtained a
for obs ID 0400270101, but
this observation seemed to be affected by the rapidly variable Seyfert 1.5 NGC 3227.
Binder et al. (2009) and Younes et al. (2011) found similar results for this galaxy, and
interpretated the variability as related to outflows or feedback processes.
Appendix A.3: NGC 3627
Together with NGC 3628 and NGC 3623, these three galaxies form the Leo Triplet (see Fig. C.27 in González-Martín et al. 2009b). Cappellari et al. (1999) classified it as a type 2.0 LINER.
This galaxy was observed twice with Chandra, in 1999 and 2008, and once with XMM-Newton, in 2001.
Ho et al. (2001) and Panessa et al. (2006) studied Chandra Obs ID 394 from 1999, using the PL model with Γ = 1.8, deriving similar luminosities, log (L(2−10 keV)) = 37.6 and 37.9, respectively. Chandra Obs ID 9548 was analyzed by Grier et al. (2011), who used the PL with Γ = 2 to obtain log (L(0.3−8 keV)) = 38.51 ± 0.03. We used the MEPL model to fit this spectrum and obtained a higher luminosity log (L(2−10) keV)) = 39.2+ 1.9, the difference is most probably due to the different models used for the analysis. The XMM-Newton observation was analyzed by González-Martín et al. (2009b) and Brightman & Nandra (2011), who used PL and MEPL models to calculate the luminosities, and derived log (L(2−10 keV)) = 39.2 ± 0.1 and 39.5, respectively, with which our results agree (39.4 ± 0.1).
No information on UV was found in the literature.
Appendix A.4: NGC 4261
NGC 4261 contains a pair of symmetric kpc-scale jets (Birkinshaw & Davies 1985) and a nuclear disk of dust roughly perpendicular to the radio jet (Ferrarese et al. 1996). Ho et al. (1997) classified it as a type 2.0 LINER.
It has been observed twice with Chandra, in 2000 and 2008, and with XMM-Newton in another three epochs from 2001 to 2007. However, only the analyses on Chandra Obs ID 834 and XMM-Newton Obs ID 56340101 are published.
Satyapal et al. (2005), Rinn et al. (2005), and Donato et
al. (2004) reported quite consistent spectral parameters by fitting the
Chandra spectra with a thermal and a power-law component, but with
a range of variation in the reported luminosities
log (L(2−10 keV)) between 40.5 and 41.0. On the other hand,
González-Martín et al. (2009b) and Zezas et al. (2005) fitted the spectra with the
ME2PL, using the same value for the spectral index for the two PL in the case of González-Martín et al. (2009b) and varying the
spectral index in the case of Zezas et al.
(2005). The comparison of the spectral parameters is quite consistent with
the largest difference being the NH,
16.45 × 1022 cm-2 for González-Martín et al. (2009b) and 8.4 × 1022 cm-2
for Zezas et al. (2005); this leads to a higher
luminosity in Zezas et al. (2005),
log (L(2−10 keV)) = 42.0, against
 in González-Martín et al. (2009b). We used the
ME2PL model to fit this spectrum and found spectral parameters and luminosities in
agreement with González-Martín et al. (2009b).
in González-Martín et al. (2009b). We used the
ME2PL model to fit this spectrum and found spectral parameters and luminosities in
agreement with González-Martín et al. (2009b).
The XMM-Newton observation Obs ID 056340101 taken in 2001 was
analyzed by González-Martín et al. (2009b),
Sambruna et al. (2003), and Gliozzi et al. (2003). Different models were used
for the three works: an absorbed PL (Gliozzi et al.
2003), an absorbed MEPL (Sambruna et al.
2003) and the ME2PL (González-Martín et al.
2009b). This could explain, in principle, the different reported
luminosities. Our results ( ) agree well with the
spectral parameters and luminosities (
) agree well with the
spectral parameters and luminosities ( )
reported by González-Martín et al. (2009b), but
not with those obtained by Sambruna et al.
(2003) and Gliozzi et al. (2003)
(41.9).
)
reported by González-Martín et al. (2009b), but
not with those obtained by Sambruna et al.
(2003) and Gliozzi et al. (2003)
(41.9).
No information from the UV was found in the literature.
Appendix A.5: NGC 4278
NGC 4278 is an elliptical galaxy classified as type 1.9 LINER by Ho et al. (1997), who found a relatively weak, broad Hα line. The north-northwest side of the galaxy is heavily obscured by large-scale dust-lanes, whose distribution shows several dense knots interconnected by filaments (Carollo et al. 1997).
This galaxy has been observed in nine occasions with Chandra from 2000 to 2010 and once with XMM-Newton in 2004. Brassington et al. (2009) used six Chandra observations and found 97 variable sources within NGC 4278, in an elliptical area of 4′ centered on the nucleus. None of them are within the aperture of 3″ we used for the nuclear extraction. Chandra observations were taken by Fabbiano to study the plethora of sources detected in this galaxy (~250) (see Brassington et al. 2009; Boroson et al. 2011). The nuclear source was studied by González-Martín et al. (2009b) using Chandra obs ID 7077 taken in 2006 and XMM-Newton data. They found a hard X-ray luminosity difference of a factor of 10 between the two observations, which were attributed to the contamination of the numerous sources around the nucleus.
The nuclear variability of this source has been previously studied by Younes et al. (2010). They concluded that long timescale (months) variability is detected with a flux increase of a factor of ~3 on a timescale of a few months and a factor of 5 between the faintest and the brightest observation separated by about three years. We used three of these observations, our spectral fittings being in good agreement with theirs, although we found weaker variations in luminosities. Whereas the different Chandra observations showed no short timescale (minutes to hours) variability, during the XMM-Newton observation, where the highest flux level was detected, Younes et al. (2010) found a 10% flux increase on a short timescale of a few hours. With the same dataset we obtained a 3% variation in the same time range, the difference being most probably due to the different apertures used for the analysis.
Pellegrini et al. (2012) studied eight Chandra observations of NGC 4278. They fitted jointly the two spectra from 2010
with a thermal ( keV) plus a power law
(
keV) plus a power law
( ,
,
 cm-2) model, and compared the remaining six spectra with the results by
Younes et al. (2010), which agreed well. They
found an X-ray luminosity decrease by a factor of ~18 between 2005 and 2010. A direct
comparison with our data cannot be done because Pellegrini et al. (2012) used different obs IDs.
cm-2) model, and compared the remaining six spectra with the results by
Younes et al. (2010), which agreed well. They
found an X-ray luminosity decrease by a factor of ~18 between 2005 and 2010. A direct
comparison with our data cannot be done because Pellegrini et al. (2012) used different obs IDs.
In the UV, Cardullo et al. (2008) found that the luminosity increased a factor of 1.6 in about six months using data from HST WFPC2/F218W.
Appendix A.6: NGC 4552
This Virgo elliptical galaxy has been classified as a LINER 2.0 (Cappellari et al. 1999). A radio jet was detected with VLBI observations (Nagar et al. 2005).
It has been observed four times with Chandra from 2001 to 2012 and
with XMM-Newton in a single epoch in 2003. However, three of the
Chandra observations are not public yet, so the only reported
results came from Chandra Obs ID 2072 (Filho et al. 2004; Xu et al.
2005; González-Martín et al. 2009b;
Grier et al. 2011; Boroson et al. 2011). Filho et al.
(2004) and González-Martín et al.
(2009b) fitted the spectra to the MEPL, obtaining compatible results with
log (L(2−10 keV)) = 39.4 and
 ,
respectively. Xu et al. (2005) and Grier et al. (2011) obtained
log (L(0.3−10 keV)) = 39.6 and
,
respectively. Xu et al. (2005) and Grier et al. (2011) obtained
log (L(0.3−10 keV)) = 39.6 and
 ,
respectively, by fitting a single PL. Our results
(
,
respectively, by fitting a single PL. Our results
( )
agree well with all of them.
)
agree well with all of them.
In the UV, Cappellari et al. (1999) studied this LINER with both HST imaging (FOC) and spectroscopy (FOS), with images taken in 1991, 1993, and 1996, showing long-term variability. This agrees with Maoz et al. (2005), who used HST-ACS observations with its HRC mode and found a 20% variation of the nuclear flux in both F250W and F330W bands.
Appendix A.7: NGC 5846
NGC 5846 is a giant elliptical galaxy at the center of a small compact group of galaxies. The inner region of the galaxy contains dust and a radio core (Moellenhoff et al. 1992). Ho et al. (1997) classified this galaxy as an ambiguous case like transient 2.0 objects but the revision made by González-Martín et al. (2009b) located this object into the LINERs 2.0 category.
Three Chandra observations were made for this galaxy between 2000
and 2007 and two observations with XMM-Newton in January and August
2001. Chandra Obs ID 788 was analyzed by Filho et al. (2004), Satyapal et
al. (2005), and Trinchieri &
Goudfrooij (2002). Three different models were fitted (PL, APEC, and MEPL),
and an order-of-magnitude difference in luminosity was found between Filho et al. (2004)
(log L(2−10 keV) = 38.4) and the other two works (39.4 and
 0.4,
respectively), maybe entirely due to the different models used. Our luminosity
(
0.4,
respectively), maybe entirely due to the different models used. Our luminosity
( )
agrees well with those from Satyapal et al.
(2005) and Trinchieri & Goudfrooij
(2002). González-Martín et al. (2009b)
reported Chandra Obs ID 4009 from 2003, but we have noticed that obs
ID 4009 corresponds to the galaxy NGC 5845, not to NGC 5846. The
XMM-Newton observations reported by González-Martín et al. (2009b) based on data taken on 2001 were fitted with
the ME2PL model, resulting in a
)
agrees well with those from Satyapal et al.
(2005) and Trinchieri & Goudfrooij
(2002). González-Martín et al. (2009b)
reported Chandra Obs ID 4009 from 2003, but we have noticed that obs
ID 4009 corresponds to the galaxy NGC 5845, not to NGC 5846. The
XMM-Newton observations reported by González-Martín et al. (2009b) based on data taken on 2001 were fitted with
the ME2PL model, resulting in a  ,
in agreement with our results (
,
in agreement with our results ( 0.0).
0.0).
Appendix B: X-ray images
In this Appendix we present the images from Chandra (left) and XMM-Newton (right) that we used to compare data from these instruments in the 0.5–10 keV band. Big circles represent 25″ apertures. Small circles in the left figures represent the nuclear extraction aperture used with Chandra observations (see Table 2). In all cases, the gray levels extend from twice the value of the background dispersion to the maximum value at the center of each galaxy.
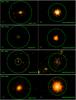 |
Fig. B.1 Images for Chandra data (left) and XMM-Newton data (right) for the sources in the 0.5–10 keV band. Big circles represent 25′′ apertures. Small circles in the left figures represent the nuclear extraction aperture used with Chandra observations (see Table 2). |
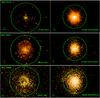 |
Fig. B.1 continued. |
Appendix C: Light curves
The plots corresponding to the light curves are provided.
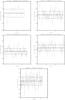 |
Fig. C.1 Light curves for NGC 1052. |
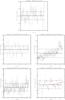 |
Fig. C.2 Light curves for NGC 3226 (up). Light curve from NGC 3227 (middle-right), where the red solid line represents a linear regresion, and the light curve from the background (middle-left). XMM-Newton obs ID 0400270101 image (down). The background follows the same behavior as NGC 3227. |
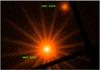 |
Fig. C.2 continued. |
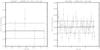 |
Fig. C.3 Light curves for NGC 3627. |
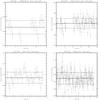 |
Fig. C.4 Light curves for NGC 4261. |
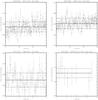 |
Fig. C.5 Light curves for NGC 4278. |
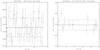 |
Fig. C.6 Light curves for NGC 4552. |
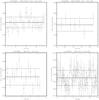 |
Fig. C.7 Light curves for NGC 5846. |
EPIC pn is the most efficient camera because X-ray photons hit the detector from the rear side, avoiding cross-calibration problems between the pn and MOS cameras (Strüder et al. 2001).
Note that we did not take into account obs ID 0400270101 from NGC 3226 (see Sect. 5.1.2).
Although the dependence on the bolometric luminosity does not seem to be so strong according to González-Martín & Vaughan (2012).
Variations are needed for more than one parameter in the spectral fitting.
Acknowledgments
We thank the anonymous referee for his/her helpful comments that helped to improve the paper, T. Mahoney for reviewing the English, J. Perea for help with the statistical analysis and the AGN group at the IAA for helpful comments during this work. This work was financed by MINECO grant AYA 2010-15169, Junta de Andalucía TIC114 and Proyecto de Excelencia de la Junta de Andalucía P08-TIC-03531. L.H.G. acknowledges financial support from the Ministerio de Economía y Competitividad through the Spanish grant FPI BES-2011-043319. O.G.M. thanks Spanish MINECO through a Juan de la Cierva Fellowship. This research made use of data obtained from the Chandra Data Archive provided by the Chandra X-ray Center (CXC). This research made use of data obtained from the XMM-Newton Data Archive provided by the XMM-Newton Science Archive (XSA). This research made use of the NASA/IPAC extragalactic database (NED), which is operated by the Jet Propulsion Laboratory under contract with the National Aeronautics and Space Administration.
References
- Alston, W. N., Vaughan, S., & Uttley, P. 2013, MNRAS, 429, 75 [NASA ADS] [CrossRef] [Google Scholar]
- Antonucci, R. 1993, ARA&A, 31, 473 [Google Scholar]
- Binder, B., Markowitz, A., & Rothschild, R. E. 2009, ApJ, 691, 431 [NASA ADS] [CrossRef] [Google Scholar]
- Birkinshaw, M., & Davies, R. L. 1985, ApJ, 291, 32 [NASA ADS] [CrossRef] [Google Scholar]
- Boroson, B., Kim, D.-W., & Fabbiano, G. 2011, ApJ, 729, 12 [NASA ADS] [CrossRef] [Google Scholar]
- Box, G. E. P. 1953, Biometrika, 40, 318 [Google Scholar]
- Braito, V., Ballo, L., Reeves, J. N., et al. 2013, MNRAS, 428, 2516 [NASA ADS] [CrossRef] [Google Scholar]
- Brassington, N. J., Fabbiano, G., Kim, D.-W., et al. 2009, ApJS, 181, 605 [NASA ADS] [CrossRef] [Google Scholar]
- Brenneman, L. W., Weaver, K. A., Kadler, M., et al. 2009, ApJ, 698, 528 [NASA ADS] [CrossRef] [Google Scholar]
- Brightman, M., & Nandra, K. 2011, MNRAS, 413, 1206 [CrossRef] [Google Scholar]
- Caballero-Garcia, M. D., Papadakis, I. E., Nicastro, F., & Ajello, M. 2012, A&A, 537, A87 [NASA ADS] [CrossRef] [EDP Sciences] [Google Scholar]
- Cappellari, M., Renzini, A., Greggio, L., et al. 1999, ApJ, 519, 117 [NASA ADS] [CrossRef] [Google Scholar]
- Cardullo, A., Corsini, E. M., Beifiori, A., Pizzella, A., & Buson, L. M. 2008, in Formation and Evolution of Galaxy Disks, eds. J. G. Funes, & E. M. Corsini, ASP Conf. Ser., 396, 53 [Google Scholar]
- Carollo, C. M., Franx, M., Illingworth, G. D., & Forbes, D. A. 1997, ApJ, 481, 710 [NASA ADS] [CrossRef] [Google Scholar]
- Dickey, J. M., & Lockman, F. J. 1990, ARA&A, 28, 215 [NASA ADS] [CrossRef] [MathSciNet] [Google Scholar]
- Donato, D., Sambruna, R. M., & Gliozzi, M. 2004, ApJ, 617, 915 [NASA ADS] [CrossRef] [Google Scholar]
- D’Onofrio, M., Marziani, P., & Sulentic, J. W. 2012, Fifty Years of Quasars: Current Impressions and Future Perspectives, 549 [Google Scholar]
- Dopita, M. A., & Sutherland, R. S. 1995, ApJ, 455, 468 [NASA ADS] [CrossRef] [Google Scholar]
- Dudik, R. P., Satyapal, S., Gliozzi, M., & Sambruna, R. M. 2005, ApJ, 620, 113 [NASA ADS] [CrossRef] [Google Scholar]
- Emmanoulopoulos, D., Papadakis, I. E., McHardy, I. M., et al. 2012, MNRAS, 424, 1327 [NASA ADS] [CrossRef] [Google Scholar]
- Eracleous, M., Hwang, J. A., & Flohic, H. M. L. G. 2010, ApJS, 187, 135 [NASA ADS] [CrossRef] [Google Scholar]
- Evans, D. A., Hardcastle, M. J., Croston, J. H., Worrall, D. M., & Birkinshaw, M. 2005, MNRAS, 359, 363 [NASA ADS] [CrossRef] [Google Scholar]
- Ferrarese, L., Ford, H. C., & Jaffe, W. 1996, ApJ, 470, 444 [NASA ADS] [CrossRef] [Google Scholar]
- Ferrarese, L., Ford, H. C., Huchra, J., et al. 2000, ApJS, 128, 431 [NASA ADS] [CrossRef] [Google Scholar]
- Filho, M. E., Fraternali, F., Markoff, S., et al. 2004, A&A, 418, 429 [NASA ADS] [CrossRef] [EDP Sciences] [Google Scholar]
- Garmire, G. P., Bautz, M. W., Ford, P. G., Nousek, J. A., & Ricker, J. G. R. 2003, in SPIE Conf. Ser., eds. J. E. Truemper, & H. D. Tananbaum, 4851, 28 [Google Scholar]
- George, I. M., Mushotzky, R. F., Yaqoob, T., et al. 2001, ApJ, 559, 167 [NASA ADS] [CrossRef] [Google Scholar]
- Gliozzi, M., Sambruna, R. M., & Brandt, W. N. 2003, A&A, 408, 949 [NASA ADS] [CrossRef] [EDP Sciences] [Google Scholar]
- Gondoin, P., Orr, A., & Siddiqui, H. 2004, A&A, 420, 905 [NASA ADS] [CrossRef] [EDP Sciences] [Google Scholar]
- González-Martín, O., & Vaughan, S. 2012, A&A, 544, A80 [NASA ADS] [CrossRef] [EDP Sciences] [Google Scholar]
- González-Martín, O., Masegosa, J., Márquez, I., & Guainazzi, M. 2009a, ApJ, 704, 1570 [NASA ADS] [CrossRef] [Google Scholar]
- González-Martín, O., Masegosa, J., Márquez, I., Guainazzi, M., & Jiménez-Bailón, E. 2009b, A&A, 506, 1107 [NASA ADS] [CrossRef] [EDP Sciences] [Google Scholar]
- González-Martín, O., Papadakis, I., Braito, V., et al. 2011a, A&A, 527, A142 [NASA ADS] [CrossRef] [EDP Sciences] [Google Scholar]
- González-Martín, O., Papadakis, I., Reig, P., & Zezas, A. 2011b, A&A, 526, A132 [NASA ADS] [CrossRef] [EDP Sciences] [Google Scholar]
- Grier, C. J., Mathur, S., Ghosh, H., & Ferrarese, L. 2011, ApJ, 731, 60 [NASA ADS] [CrossRef] [Google Scholar]
- Gu, M., & Cao, X. 2009, MNRAS, 399, 349 [NASA ADS] [CrossRef] [Google Scholar]
- Guainazzi, M., Matt, G., & Perola, G. C. 2005, A&A, 444, 119 [NASA ADS] [CrossRef] [EDP Sciences] [Google Scholar]
- Heckman, T. M. 1980, A&A, 87, 152 [NASA ADS] [Google Scholar]
- Ho, L. C. 2008, ARA&A, 46, 475 [NASA ADS] [CrossRef] [Google Scholar]
- Ho, L. C., Filippenko, A. V., & Sargent, W. L. W. 1993, ApJ, 417, 63 [NASA ADS] [CrossRef] [Google Scholar]
- Ho, L. C., Filippenko, A. V., Sargent, W. L. W., & Peng, C. Y. 1997, ApJS, 112, 391 [NASA ADS] [CrossRef] [Google Scholar]
- Ho, L. C., Feigelson, E. D., Townsley, L. K., et al. 2001, ApJ, 549, L51 [NASA ADS] [CrossRef] [Google Scholar]
- Kalberla, P. M. W., Burton, W. B., Hartmann, D., et al. 2005, A&A, 440, 775 [NASA ADS] [CrossRef] [EDP Sciences] [Google Scholar]
- Krolik, J. H. 1999, Active galactic nuclei: from the central black hole to the galactic environment [Google Scholar]
- Mahadevan, R. 1997, ApJ, 477, 585 [NASA ADS] [CrossRef] [Google Scholar]
- Maoz, D. 2007, MNRAS, 377, 1696 [NASA ADS] [CrossRef] [Google Scholar]
- Maoz, D., Nagar, N. M., Falcke, H., & Wilson, A. S. 2005, ApJ, 625, 699 [NASA ADS] [CrossRef] [Google Scholar]
- Márquez, I. 2012, in Fifty Years of Quasars: From Early Observations and Ideas to Future Research, eds. M. D’Onofrio, P. Marziani, J. W. Sulentic, Astrophys. Space Sci. Lib. (Springer) [Google Scholar]
- Masegosa, J., Márquez, I., Ramirez, A., & González-Martín, O. 2011, A&A, 527, A23 [NASA ADS] [CrossRef] [EDP Sciences] [Google Scholar]
- McHardy, I. M., Koerding, E., Knigge, C., Uttley, P., & Fender, R. P. 2006, Nature, 444, 730 [NASA ADS] [CrossRef] [PubMed] [Google Scholar]
- Moellenhoff, C., Hummel, E., & Bender, R. 1992, A&A, 255, 35 [NASA ADS] [Google Scholar]
- Nagar, N. M., Falcke, H., & Wilson, A. S. 2005, A&A, 435, 521 [NASA ADS] [CrossRef] [EDP Sciences] [Google Scholar]
- Narayan, R., & Yi, I. 1994, ApJ, 428, L13 [NASA ADS] [CrossRef] [Google Scholar]
- Panessa, F., Bassani, L., Cappi, M., et al. 2006, A&A, 455, 173 [NASA ADS] [CrossRef] [EDP Sciences] [Google Scholar]
- Panessa, F., de Rosa, A., Bassani, L., et al. 2011, MNRAS, 417, 2426 [NASA ADS] [CrossRef] [Google Scholar]
- Pellegrini, S., Wang, J., Fabbiano, G., et al. 2012, ApJ, 758, 94 [NASA ADS] [CrossRef] [Google Scholar]
- Peterson, B. M. 1997, An Introduction to Active Galactic Nuclei, ed. B. M. Peterson [Google Scholar]
- Petrucci, P.-O., Paltani, S., Malzac, J., et al. 2013, A&A, 549, A73 [NASA ADS] [CrossRef] [EDP Sciences] [Google Scholar]
- Pian, E., Romano, P., Maoz, D., et al. 2010, MNRAS, 401, 677 [NASA ADS] [CrossRef] [Google Scholar]
- Pogge, R. W., Maoz, D., Ho, L. C., & Eracleous, M. 2000, ApJ, 532, 323 [NASA ADS] [CrossRef] [Google Scholar]
- Ptak, A., Yaqoob, T., Mushotzky, R., Serlemitsos, P., & Griffiths, R. 1998, ApJ, 501, L37 [NASA ADS] [CrossRef] [Google Scholar]
- Reynolds, C. S. 1997, MNRAS, 286, 513 [NASA ADS] [CrossRef] [Google Scholar]
- Rinn, A. S., Sambruna, R. M., & Gliozzi, M. 2005, ApJ, 621, 167 [NASA ADS] [CrossRef] [Google Scholar]
- Risaliti, G. 2002, A&A, 386, 379 [NASA ADS] [CrossRef] [EDP Sciences] [Google Scholar]
- Risaliti, G., Maiolino, R., & Bassani, L. 2000, A&A, 356, 33 [NASA ADS] [Google Scholar]
- Risaliti, G., Elvis, M., Fabbiano, G., et al. 2007, ApJ, 659, L111 [NASA ADS] [CrossRef] [Google Scholar]
- Risaliti, G., Elvis, M., Bianchi, S., & Matt, G. 2010, MNRAS, 406, L20 [NASA ADS] [Google Scholar]
- Risaliti, G., Nardini, E., Salvati, M., et al. 2011, MNRAS, 410, 1027 [NASA ADS] [CrossRef] [Google Scholar]
- Sambruna, R. M., Gliozzi, M., Eracleous, M., Brandt, W. N., & Mushotzky, R. 2003, ApJ, 586, L37 [NASA ADS] [CrossRef] [Google Scholar]
- Satyapal, S., Sambruna, R. M., & Dudik, R. P. 2004, A&A, 414, 825 [NASA ADS] [CrossRef] [EDP Sciences] [Google Scholar]
- Satyapal, S., Dudik, R. P., O’Halloran, B., & Gliozzi, M. 2005, ApJ, 633, 86 [Google Scholar]
- Schmidt, M. 1963, Nature, 197, 1040 [NASA ADS] [CrossRef] [Google Scholar]
- Shemmer, O., Brandt, W. N., Netzer, H., Maiolino, R., & Kaspi, S. 2006, ApJ, 646, L29 [NASA ADS] [CrossRef] [Google Scholar]
- Strüder, L., Briel, U., Dennerl, K., et al. 2001, A&A, 365, L18 [NASA ADS] [CrossRef] [EDP Sciences] [Google Scholar]
- Terashima, Y., & Wilson, A. S. 2003, ApJ, 583, 145 [NASA ADS] [CrossRef] [Google Scholar]
- Terlevich, R., & Melnick, J. 1985, MNRAS, 213, 841 [NASA ADS] [CrossRef] [Google Scholar]
- Tonry, J. L., Dressler, A., Blakeslee, J. P., et al. 2001, ApJ, 546, 681 [NASA ADS] [CrossRef] [Google Scholar]
- Trinchieri, G., & Goudfrooij, P. 2002, A&A, 386, 472 [NASA ADS] [CrossRef] [EDP Sciences] [Google Scholar]
- Urry, C. M., & Padovani, P. 1995, PASP, 107, 803 [NASA ADS] [CrossRef] [Google Scholar]
- Vaughan, S., Edelson, R., Warwick, R. S., & Uttley, P. 2003, MNRAS, 345, 1271 [NASA ADS] [CrossRef] [Google Scholar]
- Veilleux, S., & Osterbrock, D. E. 1987, ApJS, 63, 295 [NASA ADS] [CrossRef] [Google Scholar]
- Xu, Y., Xu, H., Zhang, Z., et al. 2005, ApJ, 631, 809 [NASA ADS] [CrossRef] [Google Scholar]
- Xu, Y.-D. 2011, ApJ, 739, 64 [NASA ADS] [CrossRef] [Google Scholar]
- Yamaoka, K., Uzawa, M., Arai, M., Yamazaki, T., & Yoshida, A. 2005, Chin. J. Astron. Astrophys. Supp., 5, 273 [Google Scholar]
- Younes, G., Porquet, D., Sabra, B., et al. 2010, A&A, 517, A33 [NASA ADS] [CrossRef] [EDP Sciences] [Google Scholar]
- Younes, G., Porquet, D., Sabra, B., & Reeves, J. N. 2011, A&A, 530, A149 [NASA ADS] [CrossRef] [EDP Sciences] [Google Scholar]
- Younes, G., Porquet, D., Sabra, B., Reeves, J. N., & Grosso, N. 2012, A&A, 539, A104 [NASA ADS] [CrossRef] [EDP Sciences] [Google Scholar]
- Yuan, F., Taam, R. E., Misra, R., Wu, X.-B., & Xue, Y. 2007, ApJ, 658, 282 [NASA ADS] [CrossRef] [Google Scholar]
- Zezas, A., Birkinshaw, M., Worrall, D. M., Peters, A., & Fabbiano, G. 2005, ApJ, 627, 711 [NASA ADS] [CrossRef] [Google Scholar]
All Tables
Final compilation of the best-fit models for the sample, including the individual best-fit model for each observation, and the simultaneous best-fit model with the varying parameters.
Soft (0.5–2 keV) and hard (2–10 keV) intrinsic luminosities for individual (Cols. 3 and 5) and simultaneous (Cols. 4 and 6) fitting.
Results for the best fit of the annular region (ring) in Chandra data, and the best fit obtained for the nucleus of XMM-Newton data when the contribution from the annular region was removed.
Statistics for the light curves. Name (Col. 1), obs ID (Col. 2), χ2/d.o.f. and the probability of being variable (Cols. 3 and 4) and normalized excess variance with errors (Cols. 5 and 6).
UV luminosities derived from the OM observations. Name (Col. 1), obs ID (Col. 2), filter (Col. 3) and luminosity (Col. 4).
All Figures
|
Fig. 1 For each object, all X-ray spectra are plotted together in the first row. Best fits and their residuals are also shown, one row per observation from the second row on. The legends contain the date (in the format yyyymmdd) and the obs ID. Details are given in Table 2. |
| In the text | |
|
Fig. 1 continued. |
| In the text | |
|
Fig. 2 Intrinsic luminosities calculated for the soft (0.5–2.0 keV) and hard (2.0–10.0 keV) energies in the simultaneous fitting and UV luminosities obtained from the data with the OM camera onboard XMM-Newton, when available. |
| In the text | |
|
Fig. 3 Anticorrelation between the spectral index, Γ from individual fits, vs. the Eddington ratio, log (Lbol/LEdd), for our sample galaxies. The solid line represents the relation given by Younes et al. (2011), while the dashed line represents that by Gu & Cao (2009), both shifted to the same bolometric correction (see text). |
| In the text | |
|
Fig. 4 Correlation between the X-ray to UV flux ratio, αox, vs. the Eddington ratio, log (Lbol/LEdd). Star symbols correspond to the sources in Younes et al. (2012). |
| In the text | |
|
Fig. B.1 Images for Chandra data (left) and XMM-Newton data (right) for the sources in the 0.5–10 keV band. Big circles represent 25′′ apertures. Small circles in the left figures represent the nuclear extraction aperture used with Chandra observations (see Table 2). |
| In the text | |
|
Fig. B.1 continued. |
| In the text | |
|
Fig. C.1 Light curves for NGC 1052. |
| In the text | |
|
Fig. C.2 Light curves for NGC 3226 (up). Light curve from NGC 3227 (middle-right), where the red solid line represents a linear regresion, and the light curve from the background (middle-left). XMM-Newton obs ID 0400270101 image (down). The background follows the same behavior as NGC 3227. |
| In the text | |
|
Fig. C.2 continued. |
| In the text | |
|
Fig. C.3 Light curves for NGC 3627. |
| In the text | |
|
Fig. C.4 Light curves for NGC 4261. |
| In the text | |
|
Fig. C.5 Light curves for NGC 4278. |
| In the text | |
|
Fig. C.6 Light curves for NGC 4552. |
| In the text | |
|
Fig. C.7 Light curves for NGC 5846. |
| In the text | |
Current usage metrics show cumulative count of Article Views (full-text article views including HTML views, PDF and ePub downloads, according to the available data) and Abstracts Views on Vision4Press platform.
Data correspond to usage on the plateform after 2015. The current usage metrics is available 48-96 hours after online publication and is updated daily on week days.
Initial download of the metrics may take a while.