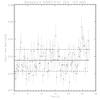
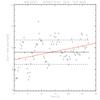
Fig. C.2
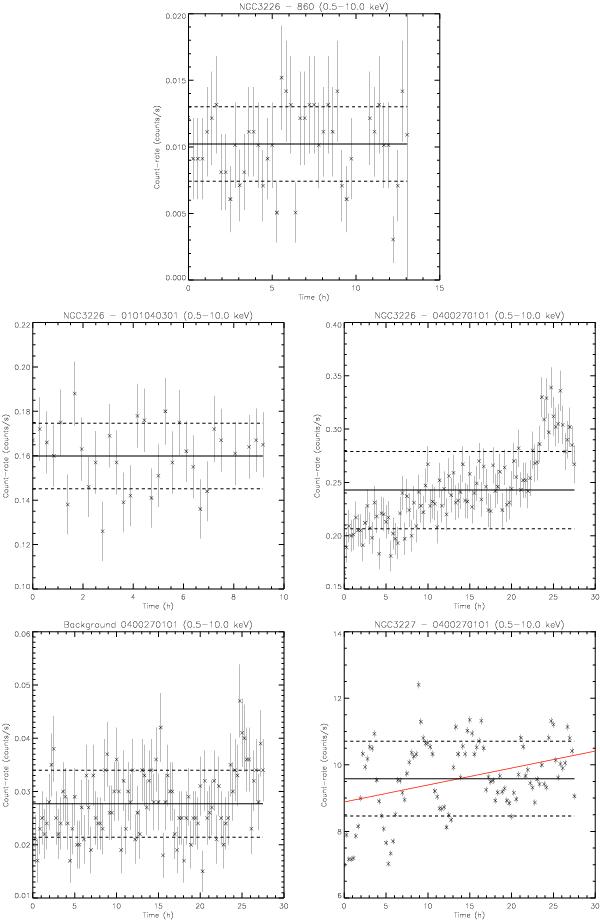
Light curves for NGC 3226 (up). Light curve from NGC 3227 (middle-right), where the red solid line represents a linear regresion, and the light curve from the background (middle-left). XMM-Newton obs ID 0400270101 image (down). The background follows the same behavior as NGC 3227.
Current usage metrics show cumulative count of Article Views (full-text article views including HTML views, PDF and ePub downloads, according to the available data) and Abstracts Views on Vision4Press platform.
Data correspond to usage on the plateform after 2015. The current usage metrics is available 48-96 hours after online publication and is updated daily on week days.
Initial download of the metrics may take a while.