Fig. 4
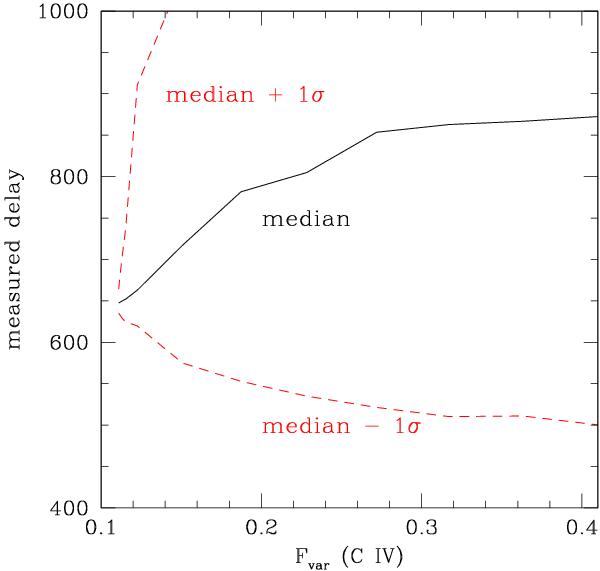
Predicted time delays in 1000 realizations of the model using the of χ2 method, with the observational setup for HET monitoring and assumed 660 day delay inserted in simulations. There is a considerable pile in the last two bins of the delay histogram at the longest time delay that increases with increasing intrinsic variability from 5% to 26%.
Current usage metrics show cumulative count of Article Views (full-text article views including HTML views, PDF and ePub downloads, according to the available data) and Abstracts Views on Vision4Press platform.
Data correspond to usage on the plateform after 2015. The current usage metrics is available 48-96 hours after online publication and is updated daily on week days.
Initial download of the metrics may take a while.