Free Access
Fig. 2
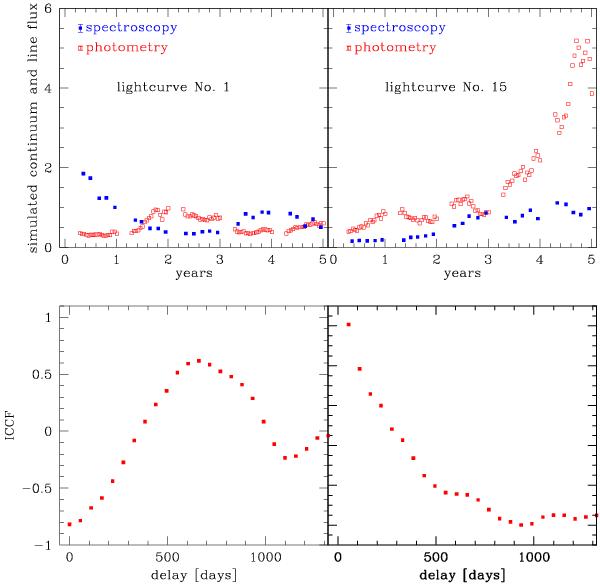
Two examples of the artificial photometric (open red circles) and spectroscopic (filled blue squares) lightcurves and the corresponding plots of the ICCF for model A. Errorbars in the lightcurves (examples shown in the upper-right corners) are not much larger than the points.
Current usage metrics show cumulative count of Article Views (full-text article views including HTML views, PDF and ePub downloads, according to the available data) and Abstracts Views on Vision4Press platform.
Data correspond to usage on the plateform after 2015. The current usage metrics is available 48-96 hours after online publication and is updated daily on week days.
Initial download of the metrics may take a while.