Fig. 1
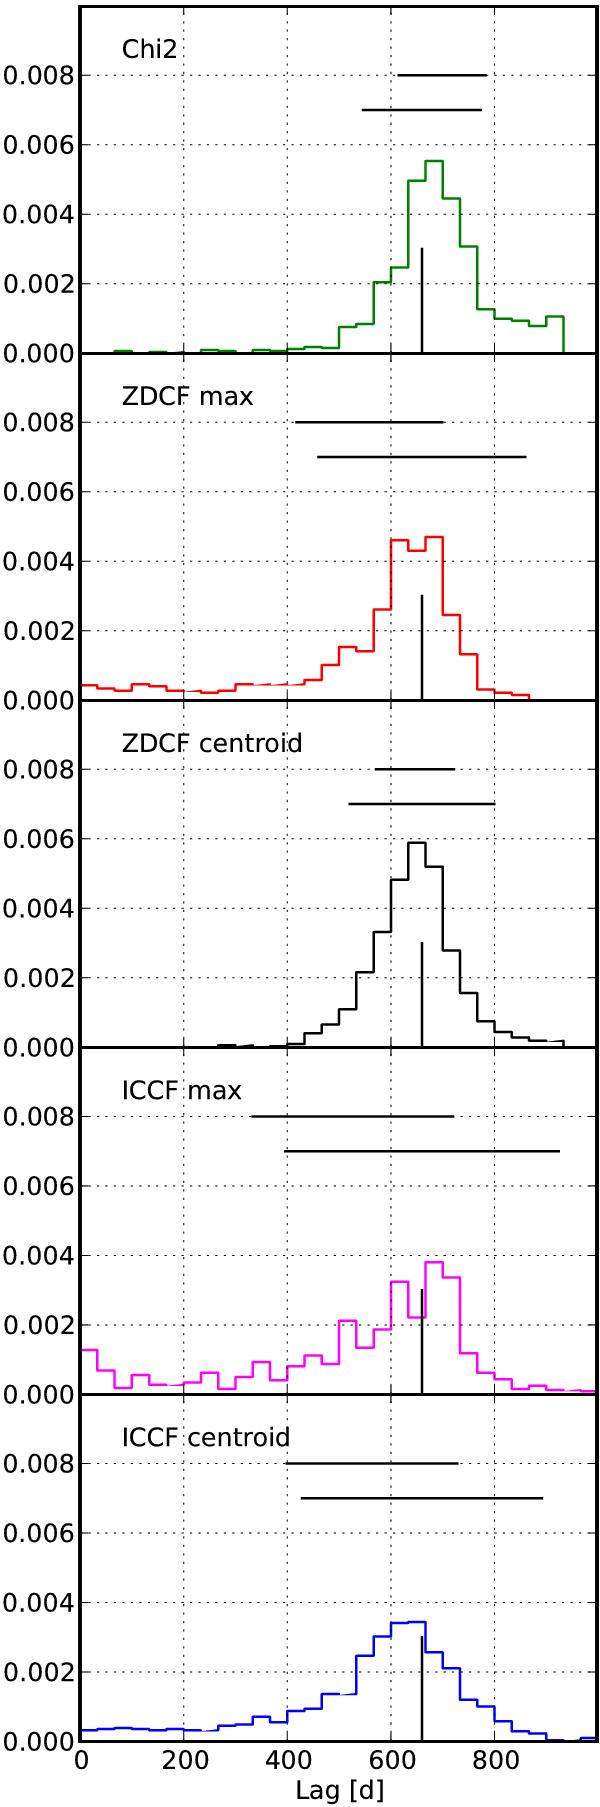
Normalized histogram of the time delays in 1000 realizations of model A, low variability, for various methods: χ2 (upper panel), ZDCF and ICCF methods (lower panels). For ZDCF and ICCF we show results both for the maximum and Gaussian centroid methods of delay determination, for χ2 method we give only the maximum method. The vertical bar marks the assumed lag value. The bottom horizontal bar marks standard deviations of the recovered values from the assumed one. The top horizontal bar marks 0.25−0.75 quantile spread of the recovered histogram. Although the average value describes well the true delay inserted into the model, there is a considerable tail of much shorter or much longer values that contributes considerably to the overall dispersion.
Current usage metrics show cumulative count of Article Views (full-text article views including HTML views, PDF and ePub downloads, according to the available data) and Abstracts Views on Vision4Press platform.
Data correspond to usage on the plateform after 2015. The current usage metrics is available 48-96 hours after online publication and is updated daily on week days.
Initial download of the metrics may take a while.