| Issue |
A&A
Volume 556, August 2013
|
|
|---|---|---|
| Article Number | A46 | |
| Number of page(s) | 9 | |
| Section | Interstellar and circumstellar matter | |
| DOI | https://doi.org/10.1051/0004-6361/201220808 | |
| Published online | 23 July 2013 | |
The excitation of circumstellar C2 in carbon-rich post-AGB object IRAS 22272+5435⋆
1 Department of Astrophysics, N. Copernicus Astronomical Center, ul. Rabiańska 8, 87-100 Toruń, Poland
e-mail: This email address is being protected from spambots. You need JavaScript enabled to view it.
2 Faculty of Physics and Mathematics, University of Latvia, Raiņa bulvāris 19, 1586 Rīga, Latvia
e-mail: This email address is being protected from spambots. You need JavaScript enabled to view it.
Received: 28 November 2012
Accepted: 13 May 2013
Abstract
Context. Observations of the circumstellar envelopes of post-asymptotic giant branch (post-AGB) stars provide information about their mass-loss history during the AGB phase and about the chemistry inside envelopes after that phase.
Aims. We analyze visual observations of C2 molecule in absorption and millimeter and sub-millimeter observations of CO molecule in emission with the aim of determining the physical and chemical conditions in the circumstellar shell of the carbon-rich post-AGB star IRAS 22272+5435.
Methods. We determined the column densities and excitation structure of C2 from equivalent width analysis of the molecular absorptions. The thermal and density structure of post-AGB shell (AGB remnant) is constrained by multilevel radiative transfer modeling of CO emission lines. The chemical structure of the envelope was computed and then used in the multilevel radiative transfer in C2 for comparison with observed column densities.
Results. We estimate the column density of C2 to be 3.2 × 1015 cm-2. From the chemical model we estimate peak abundance of C2 as 6.8 × 10⁻⁶ relative to nucleon density. The absorption of molecular lines originate in the ring between 5 and 10 × 1016 cm. The excitation temperature of the lowest levels of 58 K is consistent with the gas kinetic temperature derived from the CO modeling. The initial abundance of the parent molecule C2H2 inferred from the analysis is found to be 1.27 × 10⁻⁵ relative to nucleon density.
Conclusions. C2 molecule is a promising tool for probing the temperature structure of the envelopes of post-AGB objects and indirectly for determining the chemical abundance of acetylene.
Key words: stars: AGB and post-AGB / circumstellar matter / stars: mass-loss / line: identification
Table 1 is available in electronic form at http://www.aanda.org
© ESO, 2013
1. Introduction
The mass-loss rate at the end of the asymptotic giant branch (AGB) evolution is one of key factors determining details of further evolution toward protoplanetary nebula (PPN) and then toward planetary nebulae (PN). The PPN phase is easily recognized by the characteristic shape of the spectral energy distribution (SED) with an optical peak due to the central star and an infrared peak due to the detached shell formed by the outflowing remnant of the mass lost during the tip of AGB evolution. Objects in the early PPN phase show symptoms of the breaking of spherical symmetry, especially in the inner part of the nebulae in a region attributed to the interaction of an ejected shell with the fast wind, which start to operate during the post-AGB phase of stellar evolution.
One of the objects belonging to this group and also the subject of many studies is IRAS 22272+5435, for the first time proposed as a PPN candidate by Pottasch & Parthasarathy (1988). IRAS 22272+5435 nebula is seen in the optical range as a large bright core with two tilted ellipses (Ueta et al. 2001). Having an estimated optical depth at V band of 2.5 mag places it among optically thin circumstellar shells (Bakker et al. 1997). Early interferometric observations of nebulae with BIMA (Kwok 1997; Fong et al. 2006) in CO (1−0) show a spherically symmetric structure of the outer envelope with some deviations in the inner part. Very recent studies by Nakashima et al. (2012) also show complex inner structure observed in the CO (2 − 1) transition at angular resolution below 1 arcsec. The central object of the nebulae was identified with SAO 34504, the variable star of type of Gp Ia (Hrivnak & Kwok 1991). The monitoring of variability was continued showing variability in photometry (up to 1 mag), spectroscopy, and in velocity (Hrivnak & Lu 2000; Začs et al. 2009). The period of variability was found to be about 120 days, which is characteristic of the early phase of the post-AGB evolution.
Analyses of chemical composition of the supergiant show that this is a carbon-rich star (Začs et al. 1995; Reddy et al. 2002). The finding confirmed with the earlier detections of strong molecular bands of C3 and C2 in the optical region and radio observations of carbon-rich molecules (Hrivnak & Kwok 1991, and references therein). IRAS 22272+5435 is known as a member of group of objects with an unidentified 21 μm feature (Kwok et al. 1989), for which the carrier is still unknown.
The visual spectrum of IRAS 22272+5435 shows the narrow molecular absorptions of CN and C2 characteristic for a carbon-rich environment (Bakker et al. 1997). These narrow components originate in the circumstellar shell, which is a remnant of mass lost during the tip of AGB evolution. The observed equivalent widths of the molecular absorptions allow one to determine the column density of individual rotational levels and their excitation temperature. Analysis of the excitation mechanism of the rotational levels has not been investigated in detail. Bakker et al. (1997) suggested, however, that optical pumping may be responsible for the observed excitation of energy levels.
In this work we present a detailed analysis of molecular absorptions of C2 and modeling of its excitation in the expanding post-AGB shell. In the second section, observational material is presented. In the third the identification and results of determining equivalent widths are shown. Section 4 contains analysis of derived column densities and the rotational diagram. The chemical model of the envelopes is computed in Sect. 5. In Sect. 6 we briefly present the numerical code used for solving of multilevel non-LTE problems in an expanding envelope and present simulations of the thermal structure of envelope, taking advantage of the published observations of CO emissions lines. In the next section results of calculations and discussion of the model of excitation of C2 are presented. The obtained results are summarized in Sect. 8.
2. Observations and data reduction
A high-resolution spectrum of IRAS 22272+5435 was obtained on November 18, 2002 with the coudé echelle spectrometer MAESTRO fed by the 2 m telescope at the Observatory on the Terskol Peak in the Northern Caucasus with a resolving power of 45 000. The spectrum covered a spectral region from 3600 to 10 270 Å in 85 wavelength bands with gaps between orders beyond Hα. Each region spans from 50 to 140 Å. Unfortunately, there is a gap in the middle part of the C2 (2, 0) band. Therefore, the range of spectrum available for the Phillips band measurements covers (4, 0), (3, 0), the initial and final part of (2, 0), and a significant part of the (1, 0) band. Wavelength calibration met some problems in the (1, 0) band, where insufficient number of comparison lines was available. The wavelength calibration there therefore was based on C2 lines.
The signal-to-noise ratio in the blue region was rather low. Therefore, only wavelength region starting from 4500 Å was used for the spectral analysis. The signal-to-noise ratio in the Phillips system was at the level of above 100 except in (1, 0) band where it was degraded to 50. The spectrum has been reduced by the standard procedure using the spectral reduction package DECH. Measurements of equivalent widths were repeated with DECH’s and IRAF’s splot packages. The first approach allows for the more intuitive fit of Gaussian profile, whereas the splot package allows for objective estimation of the error of the equivalent width. In most cases, both procedures produced perfectly consistent equivalent widths differing by less than 1 mÅ. Since we expect that circumstellar lines will have similar widths, then the departure from the average value was treated as a signal of additional contaminations. The measure of that width was the full width at half maximum (FWHM) of the Gaussian fit. Typically, the FWHM of uncontaminated lines was typically 0.20 and about 0.24 Å in the (4, 0), and (1, 0) bands, respectively, as expected for instrumental broadening of unresolved lines observations. These values correspond to the half widths of lines of 8 km s-1.
During measurements of equivalent widths, the presence of telluric lines was monitored by comparison with the the spectrum of the fast-rotating star HD 218045 (B9 III, v sin i = 144 km s-1). The telluric lines were a serious problem in the (4, 0) band and less problematic in the (1, 0) band. Absorptions contaminated with telluric lines were not measured.
Another problem for measurements of equivalent widths was the existence of additional broad emissions on the red side of the selected (1, 0) absorptions. Since the signal-to-noise ratio in this range was not very high, the presence of these emissions was not quite evident.
However, we may recognize emission components in sequence of Q(6), Q(8),Q(10), and Q(12) lines (see Fig. 1). In these cases, where emissions were present, we ignored their existence in estimating the equivalent width of absorptions. Because of the low signal-to-noise ratio in the (1, 0) band, their influence on the final result was significantly lowered.
Samples of the spectrum around the band heads of C2 (1, 0), (2, 0), and of (3, 0) of the Phillips system are shown in Figs. 1 − 3, respectively. Individual lines in branches P, Q, and R are marked with the rotational number of the lower level, J′′. Because of the homonuclear nature of the 12C2 isotope, only absorptions from even rotational quantum numbers exist. For the illustration of possible complications caused by blends with stellar spectrum, the synthetic spectrum of atomic lines is overplotted and identification of lines is given in the Fig. 3. IRAS 22272+5435 is known for its overabundance of rare-earth elements (Začs et al. 1995; Reddy et al. 2002) and as seen in this figure, their presence may contaminate some molecular lines. Synthesized stellar C2 Phillips system lines are too weak to be seen in the spectrum so are not included.
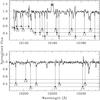 |
Fig. 1 Spectrum of IRAS 22272+5435 showing circumstellar molecular lines around band head of the C2 Phillips (1, 0) band. The thick solid line is the observed spectrum, and the telluric spectrum is shown with dots. Individual molecular lines are identified with rotational quantum number of the lower level J′′ and are shifted by − 4.1 km s-1 relative to the stellar velocity. |
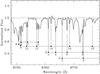 |
Fig. 2 Spectrum of IRAS 22272+5435 showing circumstellar molecular lines around the band head of the C2 Phillips (2, 0) band. The presentation is the same as in Fig. 1. |
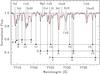 |
Fig. 3 Spectrum of IRAS 22272+5435 showing circumstellar molecular lines around the band head of the C2 Phillips (3, 0) band. The presentation is the same as in Fig. 1, with a thin (red in electronic version) line representing the synthetic spectrum of a stellar atmosphere showing only atomic lines. |
For determining the gas temperature structure in circumstellar envelope, we used the CO emission lines from the ground-based observations of Hrivnak & Bieging (2005) and Bujarrabal et al. (2001). These data were supplemented by the recent profiles of CO transitions obtained from space with Herschel/HIFI and published by Bujarrabal et al. (2012).
3. Molecular absorption lines
Molecular absorption lines are very narrow and closely resemble those of telluric absorption lines. Their identification is relatively easy since the progression of rotational lines forms characteristic sequences for each branch. We have identified the vibrational (1, 0), (2, 0), (3, 0), and (4, 0) bands of the C2 Phillips system (A2Π − X2Σ + ), the (0, 0), (1, 0) and (2, 0) C2 Swan bands (d3Πg − a3Πu), and the vibrational (1, 0), (2, 0), (3, 0), and (4, 0) bands of CN (A2Π − X2Σ + ) in the observed spectrum of IRAS 22272+5435. Identification of the measured circumstellar absorptions of Phillips C2 is given in Table 1. Identification, measurements, and detailed analysis of CN absorption lines have been postponed to a future paper. Absorption lines of C2 Swan bands are seriously blended by other members and only a few of them may be used for the quantitative analysis. It is also not a priori evident that these lines are formed in the same region as absorptions of the Phillips system. Therefore, their analysis is omitted in this work.
The energies of the rotational levels of the electronic ground state were determined using the molecular constants of Marenin & Johnson (1970). The wavelengths are generally determined from laboratory wavenumbers by Chauville et al. (1977) and Ballik & Ramsay (1963), converted to air wavelengths using Edlen’s formula following Morton (1991). Wavelengths of three lines R(2), P(2), and P(4) of the (2, 0) band, which are absent in Chauville et al. (1977), were computed with Douay (1988) spectroscopic constants. According to Douay (1988) the line positions calculated with their constants should be more accurate than the previous measurements. Vibrational oscillator strengths were taken from Langhoff et al. (1990) for (1, 0) and (2, 0), Bakker et al. (1997) for (3, 0), and from van Dishoeck (1983) for (4, 0), and they are equal to f10 = 2.38 × 10⁻³, f20 = 1.44 × 10⁻³, f30 = 6.67 × 10⁻⁴, and f40 = 2.71 × 10⁻⁴. The oscillator strengths for individual transitions were computed according to the description in Bakker et al. (1996) using their code MOLLEY. The source of band origins were Chauville et al. (1977) and Ballik & Ramsay (1963).
To confirm circumstellar origin of molecular lines one has to measure the expansion velocity of the gas. Because the stellar velocity as measured from atomic lines is variable (Začs et al. 2009), the average velocity of C2 absorption lines must be compared with the system velocity. The most natural candidate are CO emissions in the radio range. The LSR system velocity from the Doppler shift of the CO lines is −27.9 ± 0.2 km s-1 (Hrivnak & Bieging 2005; Bujarrabal et al. 2001). This converts to − 40.2 km s-1 in the heliocentric system and will be refered to later as the system velocity. The average velocity of C2 absorption lines of Phillips (2−0), (3−0), and (4−0) system is −48.7 ± 1.2 km s-1. The molecular velocity therefore is −8.5 km s-1 relative to the systemic velocity. This value is close to the expansion velocity value of 9.2 km s-1 cited by Hrivnak & Bieging (2004). Bakker et al. (1997) obtained different heliocentric velocities of absorption lines of CN, and C2: −51.8(±0.1) and −52.2(±0.2), respectively. However, to determine expansion velocity, they used CO VLSR = −30.9 km s-1 following Zuckerman & Dyck (1986). The difference of about 3 km s-1 in observed velocity of C2 absorption lines, if real, may challenge the interpretation of molecular lines as circumstellar ones, which generally should be nonvariable. The assumption of variability of C2 lines contradicts work of Začs et al. (2009).
Bakker et al. (1997) were able to measure 13 lines of C2 (3−0) Phillips system in their spectrum. The quality of their spectra obtained with WHT/UES instrument, resolution 5 × 10⁴ and FWHM of telluric lines of 6 km s-1, is quite similar to the quality of spectrum analyzed in this paper. However, the equivalent widths of 12 common lines measured in both papers disagree. The biggest differences, up to factor of three, are seen for three lines forming band heads R(4), R(6), and R(8), which are systematically lower in our spectrum. The difference could be due to a possible blend with photospheric lines of Ni I. Three lines P(4), P(6), and Q(10) are twice stronger in Bakker et al. data. The remaining lines disagree up to 50 percent, with some preference for smaller equivalent widths in our measurements. It is not evident how to understand these differences. The difference in P(4) may be ascribed to the continuum tracing due to the local continuum lowering around this line. The Bakker et al. equivalent width of Q(10) seems to be too high if the smooth variation of equivalent widths with J is expected (their EWs of Q(2), Q(4), Q(6), Q(8), and of Q(10) are 47., 59.9, 20, 33, and 65.6 mÅ, respectively). Less understood is the disagreement in equivalent widths of P(6) absorption (33.5 mÅ at Bakker et al. and 19.2 mÅ in this work), which is marked as a good in our data. Again, it may be partly due to continuum tracing (which influence both Q(10) and P(6)), but also to continuum shaping by presence of photospheric atomic lines, especially numerous lines of s-process elements, and the variability of the star. In general, the atomic absorption lines in the Bakker et al. spectrum seem to be slightly deeper and broader, as may be inferred from inspection of the broad component formed by atomic and molecular lines around 7715 Å in Fig. 3 and their Fig. 1.
On the basis of these two data sets alone, it seems that any discussion of variability in circumstellar lines is premature, and we rather think that the remaining differences between EWs are due to the continuum tracing.
4. Rotational temperature and molecular column density
Determining the column density of each rotational level is simple if transitions are optically thin. This condition was shown by Bakker et al. (1996) to be fulfilled for the rotational transitions of the (3−0) vibrational band of HD 56126. Consequently, they used this assumption to determine the column densities of rotational levels from this band for a number of post-AGB objects, including IRAS 22272+5435 (Bakker et al. 1997). In our work we apply a more general approach to determine column densities of rotational levels, together with turbulent velocity by minimizing the χ2 function. As a result we obtain a model with 13 parameters including turbulent velocity and 12 column densities. For the detailed analysis of column densities, we only used the most reliable lines, which reduced the number of them from 67 to 42. Results of the best fit are shown in Table 2. As seen, formal errors are rather small.
The populations of the optically thick lines are very sensitive to the turbulent velocity. Changing the turbulent velocity by 0.08 km s-1 (the dispersion of turbulent velocity among different bands) to 0.42 and 0.58 km s-1, we obtained column densities (4.0 ± 0.1) × 1015 and (2.81 ± 0.02) × 1015 cm-2, respectively. This is probably a realistic measure of the accuracy for the results. Individual bands produce some scatter in the best turbulent velocities ranging from 0.40 for the (2−0) band, 0.58 for the (3−0), to 0.73 for (1−0) one. The best fit to all measured lines gave a value of 0.48, which is very close to the one determined from the selected lines, but with five times larger dispersion. Final column densities determined for the best fit parameters, together with error estimation, are presented in the rotational diagram in Fig. 4. The form of presentation allows easy comparison to the diagram used elsewhere (Bakker et al. 1997). If the excitation temperature were constant, all points should lie on a single line. As seen, the distribution of points instead suggests two temperatures distribution. The numerical values of these fits are shown in Table 2.
Physical parameters derived from the C2 molecular lines.
It is worth mentioning that the distribution of points recalls the excitation of C2 in the interstellar medium (see e.g. van Dishoeck & Black 1982; Kaźmierczak et al. 2010). According to the theory of this excitation (van Dishoeck & Black 1982), the rotational temperature of the lowest levels should resemble the local gas kinetic temperature. Unfortunately, the scatter of points on the diagram does not allow for a realistic determination of the rotational temperature of the two lowest levels. Formally, the excitation temperatures obtained from the first two (T02) and three (T04) levels are  K and
K and  K, respectively.
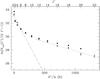 |
Fig. 4 Plot of logarithm of weighted column densities of rotational levels as function of energy levels. The dashed lines are linear least-squares fits − long-dashed for the levels J′′ ≤ 6 and short-dashed for J′′ ≤ 16. The model predictions are marked with solid points. |
Since the behavior of the excitation temperature is very similar to what is obtained for C2 by van Dishoeck & Black (1982), one could apply the model of excitation directly to the presented values. Nevertheless, as seen in the next section, the physical conditions are different from that for the optically thin case.
5. The chemical model of the shell
Chemical models of the carbon-rich envelopes have been discussed in several papers. Particularly interesting to our purpose are models describing the formation of carbon chains and cyanopolynes in IRC+10216 (Cherchneff & Glassgold 1993; Millar et al. 2000; Doty & Leung 1998). Inspection of initial abundances of parent molecules shows that significantly different values of C2H2 are used in different models.
For the computations of chemical processes we used the CSENV code (Mamon et al. 1988). This code is designated for modeling AGB envelopes, but we applied it to IRAS 22272 + 5435. To simulate chemistry in a detached shell of post-AGB star, we follow the chemical evolution of the parcels of gas expelled during AGB phase, and then remove the inner part of the envelope. The influence of the radiation of the central source on the evolution of inner boundary is not taken into account in the model.
There are indications, both from models of dust component (Szczerba et al. 1997) and of the gas component (Hrivnak & Bieging 2005), that the history of the mass-loss rate during AGB should be taken into account to get a better fit to the spectral energy distribution and to CO radio lines. In accordance with the above works, we assumed that the resulting density distribution in the post-AGB shell is a result of increasing mass loss during AGB phase. More precisely we assume that post-AGB shell has constant gas velocity of 8.5 km s-1, with density decreasing as r-3, and is irradiated by the mean interstellar radiation field (Draine 1978). This is an approximation of the time-dependent behavior with a stationary approach.
The chemical model of the envelope is not very sensitive to the detailed temperature distribution (see Fig. 11 in Doty & Leung 1998), so we follow the empirical gas temperature distribution parametrized by power law r-0.7 (Hrivnak & Bieging 2005). The chemistry in the external circumstellar zone is governed by penetrating interstellar UV radiation. The presence of UV photons in a medium causes dissociation of molecules, which is why this region is often called a photo dissociation degion (PDR). The photodissociation leads to enrichment of the medium in smaller molecules such as C2. This molecule comes from C2H2. For determining the distribution of C2 concentrations, we used a simple set of photodissociation rates from the RATE99 database (Le Teuff et al. 2000). As a free parameter we assumed initial abundance of parent molecule C2H2 relative to the nucleon density. Following Hrivnak & Bieging (2005), we built a set of chemical models corresponding to different parametrizations of the density structure. In all models we changed the dust-to-gas ratio to keep fixed value of optical depth of the dusty envelope to be consistent with the model of Szczerba et al. (1997).
The resulting concentrations of molecules that are important in the process of C2 formation, in the case of a density distribution proportional to r-3, are shown in Fig. 5. The details of formation of C2 are described below.
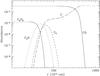 |
Fig. 5 Abundances relative to nucleon density of C2 and molecules involved in processes of its formation and destruction. |
The UV photons reach the molecular medium after passing through atomic hydrogen, so the upper limit for energies carried by photons is 13.6 eV. The acetylene can be both photodissociated and photoionized according to  with the dominance of the photodissociation reaction. Farther from the ethyl radical C2H, molecular carbon can be produced during a chain of reactions
 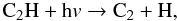 (3)and the C2 molecule can be destroyed by the following reactions:
  The photodissociation of the parent acetylene leads to a shell distribution of daughter products. The C2 abundance is rather fast enhanced via ethynyl radical (C2H) and simultaneously decreased through photodissociation and ionization. The layer of molecular carbon forms around 6 × 1016 cm in the model of choice corresponding to the density structure r-3. Although the morphology of the inner region of the shell of IRAS 22272 + 5435 shows a nonspherical shape, the outer layer shows a spherical structure. As a result, the spherically symmetric model of the envelope seems to reproduce the ring of the C2 molecule well.
The peak abundances of C2H and C2 depend on the initial abundance of acetylene. In the best fit model presented in Fig. 5, they achieve peak distributions in the ratio of 0.9:0.6:0.5 for C2H2:C2H:C2. Abundances relative to nucleon density are 1.27 × 10⁻⁵, 8.6 × 10⁻⁶, and 6.8 × 10⁻⁶ for C2H2, C2H, and C2, respectively.
Fuente et al. (1998) estimated the fractional abundance of C2H from radio observations of emission lines, assuming optically thin emission and a constant rotational temperature, constant molecular abundance, over the emitting shell. A value of X(C2H) = 5 × 10⁻⁶ was obtained for the fractional abundance of C2H. For the calculations, they have adopted the inner and external emission radii to be 4.3 × 10¹⁶ and 6.9 × 1016 cm respectively, very close to the range of C2H ring obtained here. After integration over the homogeneous shell, the column density of C2H is found to be 2.4 × 1015 cm-2. To compare this with our calculations we used their formula for estimating of fractional abundances, but we assumed that a distance of 1.67 kpc, a velocity of 8.5 km s-1, and a mass loss-rate of 3.6 × 10⁻⁵ M⊙ yr-1, which is the interpolated mass-loss rate for the mean distance of the shell. As a result we obtain X(C2H) = 2.8 × 10⁻⁶. In the chemical model presented above, the column density of C2H amounts to 7.1 × 1015 cm-2, a value that is three times higher. Due to the simplifications of the Fuente et al. (1998) approach, the difference seems to be acceptable.
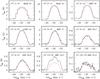 |
Fig. 6 Observed profiles of CO emission lines and model fits. |
6. Model of envelope
For better understanding of excitation of C2 in envelope we computed the multilevel radiative transfer in outflowing gas using the code shortly described below. First, the thermal structure was determined by searching for the best fit to published observations of CO lines. Then we applied the model for computations of C2.
6.1. Numerical code
To model the circumstellar absorption and emission lines, we have developed a numerical code to solve the non-LTE radiative transfer in molecular lines simultaneously with the solution of thermal structure (Schmidt et al., in prep.). The idea behind it was to consistently include the effects of the optical pumping by the central star and of the infrared pumping by a circumstellar dust shell on the population of molecular levels. The first effect would be more important in the case of post-AGB stars, as considered below. The second one is more important in AGB stars (see e.g. Truong-Bach et al. 1987).
The radiative transfer equation is formulated in the comoving frame (Mihalas et al. 1975) including the effects of an expanding spherical shell. The only difference is linearization of the differential equations along tangent rays on the geometrical grid instead of the optical depth grid. The purpose of this modification was to avoid numerical problems when maser or laser transitions emerge during iterations.
The simultaneous solution of the statistical equilibrium equations and of the radiative transfer in lines is a nonlinear process, and to be efficient it requires linearization of the equations. Full linearization of the radiative transfer equation is very complex, and its solution is time-consuming. In the code we followed the approach presented by Schoenberg & Hempe (1986). The original formulation of their approximate Newton-Raphson operator was modified to include the geometrical formulation of radiative transfer mentioned earlier.
The code has an option to compute thermal structure of the envelope self-consistently. Gas heating processes include gas-grain collisions and a photoelectric effect. Cooling processes include adiabatic and molecular cooling. Details will be given elsewhere (Schmidt et al., in prep.). The code is quite versatile and may be used for different molecules defined in the input file.
6.2. CO
Hrivnak & Bieging (2005) modeled CO transitions (2 − 1), (3 − 2) and (4 − 3) assuming gas temperature structure parametrized by the power law, T(r) ∝ r-0.7, and searching for the density distribution that reproduces the observed profiles.
Here, we extend their approach by computing consistent thermal structure of the envelope. In addition to the Hrivnak & Bieging (2005) observations, we add CO (1−0), (2 − 1) observations obtained with IRAM (Bujarrabal et al. 2001), and recent Herschel/HIFI observations of CO (6 − 5), (10 − 9), and (16 − 15) transitions (Bujarrabal et al. 2012). The emission profiles of analyzed CO transitions are shown in Fig. 6 with information on the radio telescope used and their beam size. The average uncertainties of fluxes estimated by their authors are about 15 percent.
We assume the distance to the star to be 1.67 kpc, the value inferred from Szczerba et al. (1997), instead of 1.9 kpc as assumed by Hrivnak & Bieging (2005). We limit ourselves to a spherically symmetric envelope. This assumption is justified for the outer part of envelope by the earlier observations of Neri et al. (1998). Recent interferometric studies in CO (2 − 1) line by Nakashima et al. (2012) show that the inner structure is more complicated. Inclusion of inner torus and spherically symmetric wind is necessary for the description of observed CO (2 − 1) maps. Assuming the same distance as in the model of dusty envelope (Szczerba et al. 1997), d = 1.67 kpc, they reproduce emission flux assuming inner torus radius of 1 arcsec (1016 cm) and outer torus radius of 2.5 arcsec (2.5 × 1016 cm). The outer radius is consistent with the estimation of the main dust shell radius of 2.4 × 1016 cm by Szczerba et al. (1997).
For the initial abundance of CO we assume 7 × 10⁻⁴ relative to molecular hydrogen (Hrivnak & Bieging 2005), which is inferred from our chemical model (about 3.3 × 10⁻⁴ relative to nucleon density). The computations have been made for a purely rotational model of CO taken from LAMDA web page1 (Schöier et al. 2005). We did not include vibrational levels of CO because strong vibrational transitions remove infrared photons very quickly from the outer part of the envelope (see e.g. (Hrivnak & Bieging 2005). Both the full radiative transfer method and the large velocity gradient (LVG) approach were used in the computations.
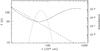 |
Fig. 7 Gas temperature structure reproducing observed emission profiles of CO (solid line). The dashed line corresponds to temperature structure scaling as r-0.7, which was used by Hrivnak & Bieging (2005). The derived distribution of C2 is shown by a dotted line. |
Strictly applying models by Hrivnak & Bieging (2005), we find that the observed fluxes are reproduced well by the steep density structures, which vary between r-3 and r-4. We have found that CO 10 − 9 and 6 − 5 transitions are sensitive to the inner radius of the shell, and are reproduced well when the inner radius is on the order of 1016 cm. They therefore must be formed in the region occupied by the inner torus. Modeling this is beyond the scope in this paper. For the final fit we assume the density structure proportional to r-3, which is supported by the model of dusty envelope from Szczerba et al. (1997) where density decreases as r-2.6. In modeling the thermal structure from CO emission lines, we follow the approach of Schöier & Olofsson (2001) used for modeling envelopes of AGB stars. Here, the free parameters are the mass-loss rate and parameter h, describing unknown details of heating through the gas-dust collisions and proportional to the dust-to-gas ratio and inversely proportional to the grain density and average size of grain. Searching for the best fit to CO emission lines through consistent modeling of the thermal structure led us to very similar temperature structure and AGB mass-loss rate as predicted by Hrivnak & Bieging (2005). The good fit requires still higher values for parameter h o the order of 4, which is relatively high when compared with analyses of AGB envelopes (Schöier & Olofsson 2001). This translates to a rather small average size of the grain on the order of 100 Å, which is smaller than usually assumed, 500 Å, in AGB envelopes. This may be explained by the presence of a population of very small grains in the envelope of IRAS 22272+5435, which can be responsible for the observed infrared bands (see e.g. Szczerba et al. 1997). The dust-to-gas ratio is fixed by the dust density obtained from the spectral energy distribution (Szczerba et al. 1997) and by the gas density determined from CO lines, and the grain’s density is fixed to a typical value for the carbon-rich dust of 2.0 g cm-3.
The obtained temperature structure, that reproduces CO lines is presented in Fig. 7. The increase in temperature in the outer part is caused by the dust-gas collision heating, which is the dominant process for decreasing mass loss. Heating by the photoelectric process is less important in such cases. The excitation temperature of the lowest levels (58 K − see Table 2) is fairly consistent with the kinetic temperature obtained from the CO modeling within the C2 ring − see Fig. 7.
The fit of the modeled CO emissions to the observed profiles is presented in Fig. 6. Assuming 15 percent accuracy of the flux calibration, we can see that the fit is fairly good. The observed emissions of CO (10 − 9) and (16 − 15) are strongly influenced by the inner part and are only crudely included in the presented model.
In all computations we assume that the gas envelope is composed purely of molecular hydrogen.
6.3. C2
In the application presented below, we used the above code to compute of the populations of the C2 molecule. The structure of the molecule was adopted from van Dishoeck & Black (1982). The molecular structure of the dicarbon was modeled by the first two vibrational levels of the ground electronic state X , and the lowest vibrational level of the A
 and a
and a levels. The A is connected to the ground electronic state through the Phillips band (0, 0) and (0, 1). This band is responsible for the optical pumping effect through the absorption of the starlight around 1 μm. Since C2 is a homonuclear molecule, vibrational transitions are very weak and influence the levels populations mainly by depopulations of excited vibrational level. Even stronger than vibrational transitions are the intercombination transitions X (v = 1) to a, and a to X (v = 0) and these transitions are responsible for the effective depopulations of the excited v = 1 levels. The intensity of the intercombination transitions has been a matter of debate and is known mainly from the theoretical considerations. Some indications come from the modeling of cometary C2 emissions (Gredel et al. 1989; Lambert & Danks 1983).
Collisional rates for excitation of C2 with H2 were computed by Lavendy et al. (1991) in IOS approximation. Recently, collisional rates with He have been computed by Najar et al. (2009). Both approaches are consistent at higher kinetic temperatures. After rescaling by factor 1.36, collisional rates are close to a crude estimation made by van Dishoeck & Black (1982). Comparison with the computations of Lavendy et al. (1991) show significant differences − the C2-H2 collisional de-excitation rates are lower by a factor of 5. This most probably shows the range of uncertainties met in computations. In the model we applied the original approach by van Dishoeck & Black (1982). The gas temperature structure is taken from the CO modelling presented above.
A circumstellar shell around post-AGB star is illuminated both by the central source and the interstellar radiation field. Comparison of fluxes from both sources shows that the stellar radiation is important for pumping of electronic transitions but is negligible for photodissociative rates.
The details of the physical model of the dusty circumstellar shell of IRAS 22272+5435 are given in Szczerba et al. (1997), and the main parameters are summarized below. The circumstellar shell of IRAS 22272+5435 is assumed to be spherical. The central heating source in optical wavelengths consists of a star of effective temperature of 5300 K and luminosity of 8300 L⊙. Density distribution is modeled as a variable mass wind simulating enhancement of the mass-loss rate in the last phase of AGB evolution.
The intensity of the radiation from the central star is weakened by two effects. First it is scattering by dust particles. The excitation details depend on how much exciting visible and near-IR photons will be scattered on the path between the central star and the C2 shell. Szczerba et al. (1997) predicted that in their model the total optical dust extinction in V band amounts to 1.94, and falls to 1 at the 3.9 × 1016 cm and to 0.18 at 1017 cm, counting from the outer radius. At the expected photodissociation radius, therefore, radiation field of the central object will be reduced by a factor ~ 10. The second effect is the scattering in C2 lines. The observed column density of the C2 lines is consistent with the one inferred from the absorption lines having optical depth smaller than 2. Between the internal and external edges of the C2 shell, radiation field may thus be weakened by a factor exp ( − 2).
7. Results and discussion
Results of modeling of the excitation of C2 lines are shown in Fig. 4. The comparison to the observed column densities shows a relatively good fit. The “two-temperature” structure seen in Fig. 4 is reproduced well by our computations. Most of the transitions are optically thin, and the photon flux follows mean intensities in the continuum closely. Transitions belonging to the Phillips band (0, 0) are optically thick, and the photon flux from the central star is reduced significantly on the external part of the C2 distribution, lowering the effect of optical pumping and raising the significance of the collisional processes. The two-temperature distribution of populations, seen in Fig. 4 and described in Sect. 4, is then summary effect of the internal “warm” part and the external “cool” part of the shell.
Bakker et al. (1997) noted the similarity of IRC+10216 to IRAS 22272+5435. There is still a difference between pumping in C2 − a much higher rotational temperature is observed in IRAS 22272+5435 (113 K) than in IRC+10216. Simultaneously, very similar excitation temperatures are obtained for CN (about 25 K in both stars). Such behavior could be explained if the mechanism of excitation of C2 is optical pumping, with strong source of optical photons from the central star of IRAS 22272+5435 and a weak one in IRC+10216.
The central star produces a nonnegligible amount of UV flux able to photodissociate the inner layer of the detached shell. This radiation has been neglected in the presented earlier chemical model of the circumstellar shell. Potentially, the inner PDR region could be formed with some presence of carbon chains. This region has not yet been observed in IRAS 22272+5435.
8. Conclusions
We have presented an analysis of the molecular lines formed in the circumstellar shell of the post-AGB star IRAS 22272+5435. Circumstellar absorption lines of C2 were identified in the optical spectrum of IRAS 22272+5435. Analysis of the equivalent widths of C2 absorption lines provide information about the column densities and rotational temperatures of the ground-state rotational levels. We computed the chemical structure of the envelope, using constrains from modeling of CO emission lines and modeling the spectral energy distribution. From the model we determined the abundance of the parent molecule − acetylene, but also CO and C2. Using the computed chemical structure of the envelope, we applied the code for the multilevel radiative transfer in outflowing gas for computing the populations of C2 molecule in the circumstellar envelope of IRAS 22272+5435. The temperature structure of the shell was constrained by the results of calculations of CO emission lines and by results of modeling the spectral energy distribution. The presented computations explain the populations of the rotational levels of C2 relatively well. In particular, the observed excitation temperature of the low and high rotational levels is reproduced.
Online material
Equivalent widths of the circumstellar components of the C2 Phillips System  .
.
Acknowledgments
This research was partly funded by KBN Research Grants N N203 581040 and (for L.Z.) by the Latvian Council of Science (grant 05.1863). M. Sch. and R. Sz. acknowledge support by the National Science Center under grant (DEC-2011/01/B/ST9/02229). We also acknowledge support from EU FP7-PEOPLE-2010-IRSES program in the framework of project POSTAGBinGALAXIES (Grant Agreement No. 269193), and the collaborative program between the Polish and Latvian Academies of Sciences. The spectroscopical material was obtained by Dr Faig Musaev from the Special Astrophysical Observatory, which is kindly acknowledged.
References
- Bakker, E. J., Waters, L. B. F. M., Lamers, H. J. G. L. M., Trams, N. R., & van der Wolf, F. L. A. 1996, A&A, 310, 893 [NASA ADS] [Google Scholar]
- Bakker, E. J., van Dishoeck, E. F., Waters, L. B. F. M., & Schoenmaker, T. 1997, A&A, 323, 469 [NASA ADS] [Google Scholar]
- Ballik, E. A., & Ramsay, D. A. 1963, ApJ, 137, 84 [NASA ADS] [CrossRef] [Google Scholar]
- Bujarrabal, V., Castro-Carrizo, A., Alcolea, J., & Sánchez Contreras, C. 2001, A&A, 377, 868 [NASA ADS] [CrossRef] [EDP Sciences] [Google Scholar]
- Bujarrabal, V., Alcolea, J., Soria-Ruiz, R., et al. 2012, A&A, 537, A8 [NASA ADS] [CrossRef] [EDP Sciences] [Google Scholar]
- Chauville, J., Maillard, J. P., & Mantz, A. W. 1977, J. Quant. Spec. Radiat. Transf., 68, 399 [Google Scholar]
- Cherchneff, I., & Glassgold, A. E. 1993, ApJ, 419, L41 [NASA ADS] [CrossRef] [Google Scholar]
- Doty, S. D., & Leung, C. M. 1998, ApJ, 502, 898 [NASA ADS] [CrossRef] [Google Scholar]
- Douay, M., Nietmann, R., Bernath, P. F., 1988, J. Molec. Spec., 131, 261 [NASA ADS] [CrossRef] [Google Scholar]
- Draine, B. T. 1978, ApJS, 36, 595 [NASA ADS] [CrossRef] [Google Scholar]
- Fong, D., Meixner, M., Sutton, E. C., Zalucha, A., & Welch, W. J. 2006, ApJ, 652, 1626 [NASA ADS] [CrossRef] [Google Scholar]
- Fuente, A., Cernicharo, J., & Omont, A. 1998, A&A, 330, 232 [NASA ADS] [Google Scholar]
- Gredel, R., van Dishoeck, E. F., & Black, J. H. 1989, ApJ, 338, 1047 [NASA ADS] [CrossRef] [Google Scholar]
- Hrivnak, B. J., & Bieging, J. H. 2004, in BAAS, 36, Am. Astron. Soc. Meet. Abstracts, 1427 [Google Scholar]
- Hrivnak, B. J., & Bieging, J. H. 2005, ApJ, 624, 331 [NASA ADS] [CrossRef] [Google Scholar]
- Hrivnak, B. J., & Kwok, S. 1991, ApJ, 371, 631 [NASA ADS] [CrossRef] [Google Scholar]
- Hrivnak, B. J., & Lu, W. 2000, in The Carbon Star Phenomenon, ed. R. F. Wing, IAU Symp., 177, 293 [NASA ADS] [Google Scholar]
- Kaźmierczak, M., Schmidt, M. R., Bondar, A., & Krełowski, J. 2010, MNRAS, 402, 2548 [NASA ADS] [CrossRef] [Google Scholar]
- Kwok, S. 1997, in IAU Symp. 170, eds. W. B. Latter, S. J. E. Radford, P. R. Jewell, J. G. Mangum, & J. Bally, 373 [Google Scholar]
- Kwok, S., Volk, K. M., & Hrivnak, B. J. 1989, ApJ, 345, L51 [NASA ADS] [CrossRef] [Google Scholar]
- Lambert, D. L., & Danks, A. C. 1983, ApJ, 268, 428 [NASA ADS] [CrossRef] [Google Scholar]
- Langhoff, S. R., Bauschlicher, J. C. W., Rendell, A. P., & Komornicki, A. 1990, J. Chem. Phys., 92, 6599 [NASA ADS] [CrossRef] [Google Scholar]
- Lavendy, H., Robbe, J. M., Chambaud, G., Levy, B., & Roueff, E. 1991, A&A, 251, 365 [NASA ADS] [Google Scholar]
- Le Teuff, Y. H., Millar, T. J., & Markwick, A. J. 2000, A&AS, 146, 157 [NASA ADS] [CrossRef] [EDP Sciences] [MathSciNet] [PubMed] [Google Scholar]
- Mamon, G. A., Glassgold, A. E., & Huggins, P. J. 1988, ApJ, 328, 797 [NASA ADS] [CrossRef] [Google Scholar]
- Marenin, I. R., & Johnson, H. R. 1970, J. Quant. Spec. Radiat. Trans., 10, 305 [NASA ADS] [CrossRef] [Google Scholar]
- Mihalas, D., Kunasz, P. B., & Hummer, D. G. 1975, ApJ, 202, 465 [NASA ADS] [CrossRef] [Google Scholar]
- Millar, T. J., Herbst, E., & Bettens, R. P. A. 2000, MNRAS, 316, 195 [NASA ADS] [CrossRef] [Google Scholar]
- Morton, D. C. 1991, ApJS, 77, 119 [NASA ADS] [CrossRef] [Google Scholar]
- Najar, F., Ben Abdallah, D., Jaidane, N., et al. 2009, J. Chem. Phys., 130, 204305 [NASA ADS] [CrossRef] [PubMed] [Google Scholar]
- Nakashima, J.-I., Koning, N., Volgenau, N. H., et al. 2012, ApJ, 759, 61 [NASA ADS] [CrossRef] [Google Scholar]
- Neri, R., Kahane, C., Lucas, R., Bujarrabal, V., & Loup, C. 1998, A&AS, 130, 1 [NASA ADS] [CrossRef] [EDP Sciences] [Google Scholar]
- Pottasch, S. R., & Parthasarathy, M. 1988, A&A, 192, 182 [NASA ADS] [Google Scholar]
- Reddy, B. E., Lambert, D. L., Gonzalez, G., & Yong, D. 2002, ApJ, 564, 482 [NASA ADS] [CrossRef] [Google Scholar]
- Schoenberg, K., & Hempe, K. 1986, A&A, 163, 151 [NASA ADS] [Google Scholar]
- Schöier, F. L., & Olofsson, H. 2001, A&A, 368, 969 [NASA ADS] [CrossRef] [EDP Sciences] [Google Scholar]
- Schöier, F. L., van der Tak, F. F. S., van Dishoeck, E. F., & Black, J. H. 2005, A&A, 432, 369 [NASA ADS] [CrossRef] [EDP Sciences] [Google Scholar]
- Szczerba, R., Omont, A., Volk, K., Cox, P., & Kwok, S. 1997, A&A, 317, 859 [NASA ADS] [Google Scholar]
- Truong-Bach, Nguyen-Q-Rieu, Omont, A., Olofsson, H., & Johansson, L. E. B. 1987, A&A, 176, 285 [NASA ADS] [Google Scholar]
- Ueta, T., Meixner, M., Hinz, P. M., et al. 2001, ApJ, 557, 831 [NASA ADS] [CrossRef] [Google Scholar]
- van Dishoeck, E. F. 1983, Chem. Phys., 77, 277 [NASA ADS] [CrossRef] [Google Scholar]
- van Dishoeck, E. F., & Black, J. H. 1982, ApJ, 258, 533 [NASA ADS] [CrossRef] [Google Scholar]
- Začs, L., Klochkova, V. G., & Panchuk, V. E. 1995, MNRAS, 275, 764 [NASA ADS] [CrossRef] [Google Scholar]
- Začs, L., Sperauskas, J., Musaev, F. A., et al. 2009, ApJ, 695, L203 [NASA ADS] [CrossRef] [Google Scholar]
- Zuckerman, B., & Dyck, H. M. 1986, ApJ, 311, 345 [NASA ADS] [CrossRef] [Google Scholar]
All Tables
All Figures
|
Fig. 1 Spectrum of IRAS 22272+5435 showing circumstellar molecular lines around band head of the C2 Phillips (1, 0) band. The thick solid line is the observed spectrum, and the telluric spectrum is shown with dots. Individual molecular lines are identified with rotational quantum number of the lower level J′′ and are shifted by − 4.1 km s-1 relative to the stellar velocity. |
| In the text | |
|
Fig. 2 Spectrum of IRAS 22272+5435 showing circumstellar molecular lines around the band head of the C2 Phillips (2, 0) band. The presentation is the same as in Fig. 1. |
| In the text | |
|
Fig. 3 Spectrum of IRAS 22272+5435 showing circumstellar molecular lines around the band head of the C2 Phillips (3, 0) band. The presentation is the same as in Fig. 1, with a thin (red in electronic version) line representing the synthetic spectrum of a stellar atmosphere showing only atomic lines. |
| In the text | |
|
Fig. 4 Plot of logarithm of weighted column densities of rotational levels as function of energy levels. The dashed lines are linear least-squares fits − long-dashed for the levels J′′ ≤ 6 and short-dashed for J′′ ≤ 16. The model predictions are marked with solid points. |
| In the text | |
|
Fig. 5 Abundances relative to nucleon density of C2 and molecules involved in processes of its formation and destruction. |
| In the text | |
|
Fig. 6 Observed profiles of CO emission lines and model fits. |
| In the text | |
|
Fig. 7 Gas temperature structure reproducing observed emission profiles of CO (solid line). The dashed line corresponds to temperature structure scaling as r-0.7, which was used by Hrivnak & Bieging (2005). The derived distribution of C2 is shown by a dotted line. |
| In the text | |
Current usage metrics show cumulative count of Article Views (full-text article views including HTML views, PDF and ePub downloads, according to the available data) and Abstracts Views on Vision4Press platform.
Data correspond to usage on the plateform after 2015. The current usage metrics is available 48-96 hours after online publication and is updated daily on week days.
Initial download of the metrics may take a while.