Free Access
Fig. 4
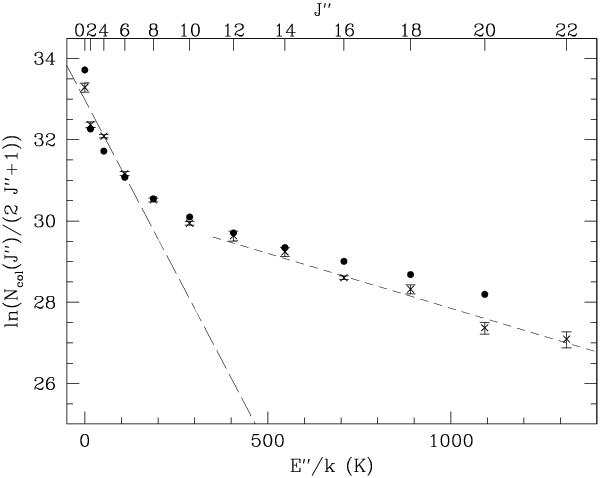
Plot of logarithm of weighted column densities of rotational levels as function of energy levels. The dashed lines are linear least-squares fits − long-dashed for the levels J′′ ≤ 6 and short-dashed for J′′ ≤ 16. The model predictions are marked with solid points.
Current usage metrics show cumulative count of Article Views (full-text article views including HTML views, PDF and ePub downloads, according to the available data) and Abstracts Views on Vision4Press platform.
Data correspond to usage on the plateform after 2015. The current usage metrics is available 48-96 hours after online publication and is updated daily on week days.
Initial download of the metrics may take a while.