Fig. 2
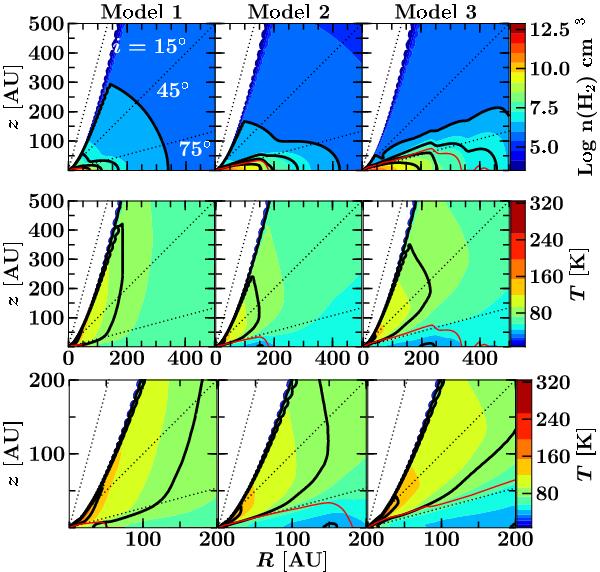
Final disk structure for the three models from Table 1 at t = tacc. Top: gas density in the inner 500 AU. The solid line contours mark densities of 106,7,8,9 cm-3. Middle: temperature structure in the inner 500 AU. The temperature contours are logarithmically spaced from 10 to 320 K. The 20, 50 and 100 K isotherms are marked by the solid line contours. Bottom: temperature structure in the inner 200 AU. In all panels, the dotted lines illustrate the lines of sight at inclinations of 15°, 45° and 75° and the red line indicates the final disk surface.
Current usage metrics show cumulative count of Article Views (full-text article views including HTML views, PDF and ePub downloads, according to the available data) and Abstracts Views on Vision4Press platform.
Data correspond to usage on the plateform after 2015. The current usage metrics is available 48-96 hours after online publication and is updated daily on week days.
Initial download of the metrics may take a while.